
Jump through this article33 sections
On this page
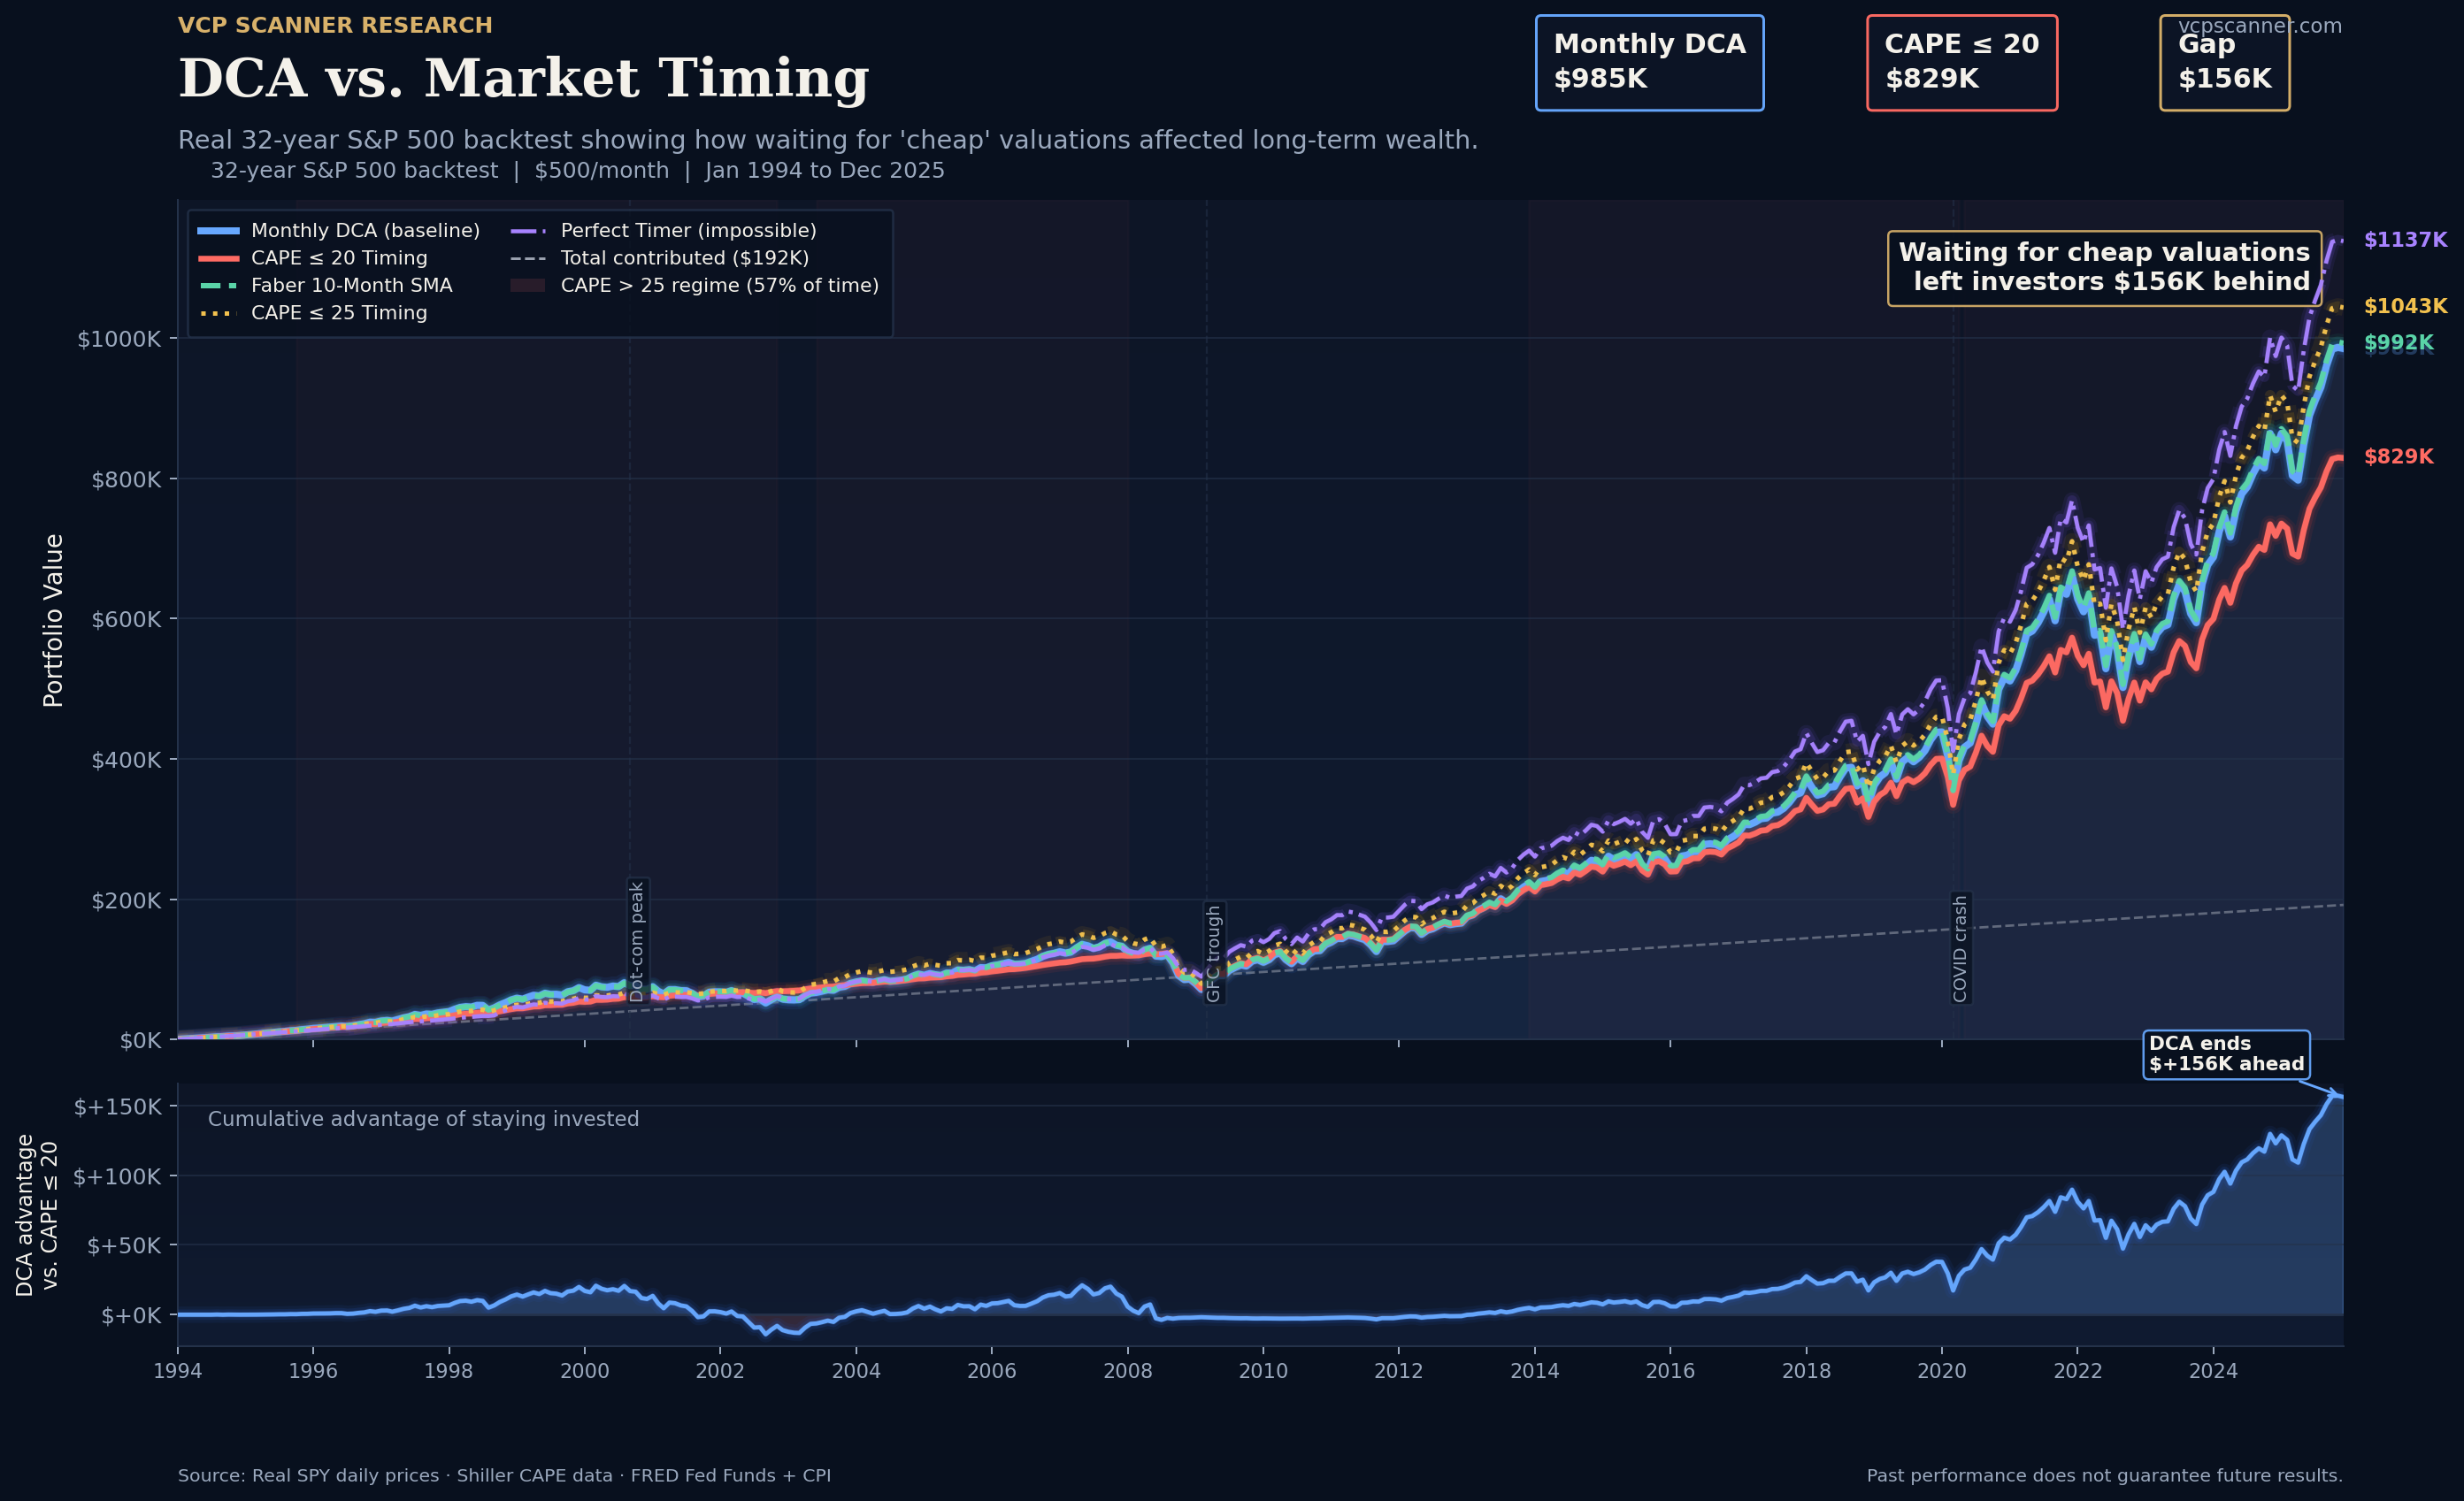
Data source: 32 years of real SPY daily prices from our production database, Shiller CAPE data, FRED Fed Funds and CPI data. Simulation period: January 1994 – December 2025. $500/month contribution, $192,000 total contributed.
Every few years, a market pundit resurfaces with the same argument: "The market is expensive. Stop investing. Wait for the CAPE ratio to come down."
Over the past 32 years, investors who followed that advice lost $156,000 compared to those who ignored it.
We tested it. Rigorously. Here is everything the data shows.
TL;DR — Key Findings at a Glance#
If you read nothing else: monthly DCA ranked #5 of 12 strategies tested. CAPE-based timing ranked dead last. The market was "overvalued" (CAPE > 25) for 57% of the past 32 years. Waiting for cheap valuations cost investors $156K and 16 years of compounding.
| Finding | Number |
|---|---|
| Strategies tested | 12 |
| Data period | Jan 1994 – Dec 2025 (32 years, 384 months) |
| Monthly contribution | $500 |
| Total contributed | $192,000 |
| Monthly DCA final value | $984,594 (5.24% CAGR) |
| CAPE≤20 timing final value | $828,693 (4.68% CAGR) |
| Loss from CAPE timing | −$155,901 |
| Best practical strategy | Faber 10-Month SMA (#4, $992,120) |
| Time market was "expensive" (CAPE > 25) | 57% of 32 years |
| Longest wait for CAPE ≤ 20 | 16 years |
| Real (inflation-adjusted) SIP CAGR | 2.64% |
| At CAPE ~37 today: 10yr median forward CAGR | 0.6% |
The 12 Strategies We Tested#
We simulated every major approach an evidence-minded investor might consider. All strategies received the same $500/month budget. Some strategies accumulated cash in a money market account (earning the Fed Funds rate) during waiting periods and deployed it as a lump sum when their signal triggered.
| # | Strategy | Final Value | CAGR | Deployed | Dry Spell |
|---|---|---|---|---|---|
| 1 | Perfect Timer (theoretical) | $1,137,488 | 5.72% | 3% | 71 mo |
| 2 | CAPE ≤ 15 | $1,125,046 | 5.68% | 2% | 198 mo |
| 3 | CAPE ≤ 25 | $1,042,926 | 5.43% | 26% | 85 mo |
| 4 | Faber 10-Month SMA | $992,120 | 5.27% | 76% | 18 mo |
| 5 | Monthly DCA (baseline) | $984,594 | 5.24% | 100% | 0 mo |
| 6 | Value Averaging (10% target) | $979,755 | 5.23% | 93% | 7 mo |
| 7 | Below SMA-200 | $933,826 | 5.07% | 24% | 43 mo |
| 8 | Hybrid 60/40 CAPE≤20 | $922,234 | 5.03% | 105% | 0 mo |
| 9 | Crash Buyer −20% | $917,045 | 5.01% | 32% | 96 mo |
| 10 | Crash Buyer −10% | $893,253 | 4.92% | 37% | 76 mo |
| 11 | CAPE-Proportional SIP | $877,604 | 4.86% | 100% | 0 mo |
| 12 | CAPE ≤ 20 | $828,693 | 4.68% | 5% | 192 mo |
"Dry spell" = longest consecutive months in cash, not invested. "Deployed" = % of monthly contributions that went directly into SPY.
The three strategies above Monthly DCA (#1–3) are either theoretically impossible (Perfect Timer), statistically bankrupt (CAPE≤15, with only 5 trigger months in 32 years), or come with extreme concentration risk (CAPE≤25's 85-month wait).
The six strategies below SIP (#7–12) all destroyed wealth relative to simply investing every month.
The CAPE≤20 Disaster — By the Numbers#
CAPE-based timing is the most commonly cited reason to pause investing. The argument sounds rigorous: "Wait until stocks are cheap before buying." The data says the opposite.
The 16-Year Dry Spell#
From February 1997 to January 2013 — 16 continuous years — the S&P 500's CAPE ratio never fell below 20. An investor using CAPE≤20 timing sat in cash for this entire period.
What happened to that cash? It earned the Fed Funds rate, which averaged roughly 2.6%/year gross — but only 1.64%/year after taxes at a 37% marginal rate.
What happened to the stock market during that wait? +11.9% CAGR.
The opportunity cost was staggering.
Capital That Never Got Invested#
Over 32 years, CAPE≤20 timing invested in only 20 months out of 384 — just 5% of the time. It sat in cash for 364 months. At the end, it still had $114,616 trapped in a money market account — 13.8% of the final portfolio — that never had the chance to compound in equities.
CAPE≤20 vs. Monthly DCA in Every 5-Year Cohort#
We ran every rolling 5-year window from 1994 to 2025. CAPE≤20 beat Monthly DCA in just 5 of 27 five-year cohorts (19%).
| Period | Monthly DCA Final | CAPE≤20 Final | Winner |
|---|---|---|---|
| 1994–1999 | $74,171 | $54,298 | SIP +37% |
| 1997–2002 | $28,547 | $40,612 | CAPE≤20 ✓ |
| 2009–2014 | $57,042 | $43,476 | SIP +31% |
| 2016–2021 | $61,578 | $36,961 | SIP +67% |
| 2020–2025 | $56,725 | $40,371 | SIP +41% |
The 1997–2002 CAPE win came entirely from the dot-com crash — CAPE≤20 deployed aggressively as the crash unfolded. But that window required being mostly out of the market for all of 1997–2000's 36% runup first. Net-net, you lost more than you gained.
Over 10-year cohorts, SIP beat CAPE≤20 in 19 of 23 windows (83%).
The Valuation Map: What CAPE Actually Predicts#
CAPE does predict something real — but with a caveat that makes it nearly useless for timing.
CAPE vs. Forward 5-Year S&P 500 CAGR#
| CAPE Level | % of Time Since 1994 | Avg. 5-Yr Forward CAGR | Worst Case | Best Case |
|---|---|---|---|---|
| ≤ 15 (Extreme Cheap) | 1.3% | +17.5% | +15.3% | +21.2% |
| 15–20 (Cheap) | 3.1% | +15.8% | +7.8% | +26.0% |
| 20–25 (Fair Value) | 21.1% | +13.3% | +1.6% | +25.4% |
| 25–30 (Expensive) | 38.3% | +6.3% | −9.5% | +19.8% |
| > 30 (Bubble Territory) | 35.9% | +3.0% | −4.9% | +15.7% |
The problem is clear: the market spent 1.3% of the time at CAPE ≤ 15 and 4.4% at CAPE ≤ 20. That's 17 months out of 384.
Meanwhile, CAPE was above 25 — the level most financial writers call "overvalued" — for 57% of the entire period. An investor waiting for "cheap" spent most of their investing life on the sidelines.
What CAPE ~37 Means Today#
The S&P 500's CAPE is currently approximately 37. We found 90 historical months when CAPE sat between 32 and 42 — close analogs to today.
5-year forward CAGR distribution (from CAPE 32–42 entry points):
- Median: −0.2%
- Average: +1.6%
- Positive: 45% of the time
- Best: +15.7%
- Worst: −4.3%
10-year forward CAGR distribution (from CAPE 32–42 entry points):
- Median: +0.6%
- Average: +0.6%
- Positive: 57% of the time
- Best: +5.9%
- Worst: −5.3%
This is the honest picture. CAPE ~37 is a genuine headwind for long-term returns. But:
- Even from CAPE ~37, the market delivered positive 10-year returns 57% of the time
- The median 10-year outcome is +0.6% real CAGR — better than cash after taxes
- The alternative (sitting in cash) earned just 1.64%/year after-tax — and that's in today's high-rate environment. From 2009 to 2022, cash earned essentially zero.
The Most Emotionally Honest Test: The Frustrated Switcher#
What actually happened to investors who tried CAPE timing, waited patiently for years, and eventually gave up?
We simulated every "frustrated switcher" scenario: investors who waited for CAPE≤20 for 1, 2, 3, 5, 8, 10, or 15 years before surrendering and switching to Monthly DCA.
| Gave Up After | Final Value | vs. Monthly DCA | Notes |
|---|---|---|---|
| 1 year | $984,485 | −$110 (−0.0%) | Negligible difference — almost identical |
| 2 years | $976,980 | −$7,614 (−0.8%) | Minor drag |
| 3 years | $965,409 | −$19,185 (−1.9%) | Growing gap |
| 5 years | $912,865 | −$71,730 (−7.3%)** | Significant damage |
| 8 years | $967,358 | −$17,236 (−1.8%) | Recovered somewhat |
| 10 years | $977,819 | −$6,775 (−0.7%) | Near parity |
| 15 years | $1,001,137 | +$16,543 (+1.7%) | Finally ahead |
The 5-year switcher is the most common real-world investor. They read about CAPE in 2013 (CAPE was ~22, rising fast), started accumulating cash, waited 5 years, gave up by 2018, then switched to SIP. Result: $71,730 behind a friend who never stopped investing.
The 8 and 10-year scenarios recovered because they coincidentally caught some major entry points during their waiting period. The 15-year scenario finally beats SIP — but only by $16,543 across 180 months of patience.
The Two Best Alternatives to Monthly DCA#
Faber's 10-Month Moving Average (#4, $992,120)#
The Meb Faber strategy is simple: invest in SPY when it's above its 10-month SMA; move to cash when it falls below.
Over 32 years:
- Final value: $992,120 (vs. $984,594 for SIP)
- CAGR: 5.27% (vs. 5.24%)
- Only sat out the market 18 months total (vs. 0 for SIP)
- 76% of contributions deployed directly — much more invested than any CAPE-based strategy
- Max drawdown: 46.6% (vs. 48.6% for SIP) — slightly better downside protection
The advantage over SIP is just $7,526 — less than two months' contributions. But the real benefit is psychological: it has a clear, rules-based signal that kept investors invested during most of the bull market while offering a modest hedge during the 2001–2003 and 2008–2009 crashes.
Over all 20-year cohorts tested, Faber beat Monthly DCA in 11 of 12 windows. Over 5-year windows, it's more mixed — but it never produced catastrophic underperformance the way CAPE≤20 did.
Value Averaging (#6, $979,755)#
Michael Edleson's method targets a fixed portfolio growth rate (we used 10%/year): invest more when markets fall short of target, invest less when they exceed it.
- Final value: $979,755 (vs. $984,594 for SIP)
- Gap from SIP: −$4,839 — almost identical
- 93% deployment rate — nearly always invested
- Longest dry spell: just 7 months
Value averaging is more complex to execute than SIP for essentially zero benefit over 32 years. It's not a bad strategy, but there's no compelling reason to choose it over simply buying every month.
The "Buy the Dip" Myth#
Two strategies specifically targeted crash entry points, accumulating cash and deploying it all at once when the market fell by a set percentage from its all-time high.
Crash Buyer −10% (#10, $893,253)#
- Waited for a 10% pullback, then deployed all accumulated cash
- Final value: $893,253 — $91,341 less than SIP
- Sat in cash for 76 consecutive months (the longest single dry spell)
- Spent 97% of months underperforming SIP — the worst behavioral score of any tested strategy
Crash Buyer −20% (#9, $917,045)#
- Waited for a 20% drawdown (true bear markets)
- Final value: $917,045 — $67,549 less than SIP
- Longest wait: 96 months (8 years between deployments)
- Got great entry prices in 2002–2003 and 2009 — but missed every other rally in between
The problem with crash buying is the same as with CAPE timing: the market spends far more time grinding higher between crashes than it spends at crash lows. The 1994–2025 data shows 10 distinct crash/recovery cycles, with most troughs followed by 1-year returns of 15–38%.
The Post-Crash Evidence#
| Bear Market Trough | Drawdown | CAPE at Trough | +1yr | +3yr CAGR | +5yr CAGR |
|---|---|---|---|---|---|
| Mar 2009 (GFC) | −54.2% | 13.9 | +65.7% | +25.9% | +21.5% |
| Oct 2002 (dot-com) | −43.8% | 25.5 | +22.8% | +11.9% | +12.5% |
| Mar 2003 (dot-com II) | −44.9% | 23.8 | +34.5% | +15.6% | +9.4% |
| Oct 2011 | −28.8% | 22.1 | +28.6% | +22.4% | +14.1% |
| Dec 2018 | −4.3% | 29.1 | +15.2% | +19.4% | +11.2% |
| Mar 2020 (COVID) | −4.9% | 27.0 | +28.2% | +9.8% | +12.6% |
The 2009 crash — the ultimate crash buyer's dream — required waiting through the entire 2003–2007 bull market first. Someone waiting for a −20% crash from their start date in 2003 watched the market nearly double before their signal finally triggered.
The Real Returns Reality Check#
Nominal returns look impressive. After inflation, the picture is humbler.
From 1994 to 2025, CPI rose 2.229× — meaning prices in 2025 were 122.9% higher than 1994. Your $985K in nominal 2025 dollars has the purchasing power of just $441,817 in 1994 dollars.
| Strategy | Nominal Final | Real Final (1994 $) | Nominal CAGR | Real CAGR |
|---|---|---|---|---|
| Monthly DCA | $984,594 | $441,817 | 5.24% | 2.64% |
| Faber 10-Month SMA | $992,120 | $445,194 | 5.27% | 2.67% |
| CAPE ≤ 20 | $828,693 | $371,860 | 4.68% | 2.09% |
| Below SMA-200 | $933,826 | $419,036 | 5.07% | 2.47% |
| CAPE-Proportional | $877,604 | $393,808 | 4.86% | 2.27% |
After inflation, even the best achievable real strategy (Faber) delivers just 2.67% real CAGR. Monthly DCA delivers 2.64% — essentially identical. CAPE≤20 delivers 2.09%.
This doesn't mean investing is futile. It means the margin between strategies is measured in fractions of a percent, and the biggest enemy of your real wealth is not choosing the "wrong" strategy — it's sitting in cash while inflation compounds against you.
The Hidden Cost: After-Tax Cash Drag#
Every strategy that held cash was earning the Fed Funds rate. But the headline rate isn't what you actually keep.
At a 37% marginal income tax rate:
- Pre-tax average cash yield: 2.60%/year
- After-tax average cash yield: 1.64%/year
- Average annual tax drag on cash: 0.96%/year
By decade:
| Decade | Avg. After-Tax Cash Drag/Year |
|---|---|
| 1990s | 1.92% |
| 2000s | 1.09% |
| 2010s | 0.23% (near-zero rates) |
| 2020s | 1.02% |
Strategies like CAPE≤20 that held cash for years weren't earning 5% on that cash — they were earning 1.64% after taxes in the best recent environment. In 2013–2021, when rates were essentially zero, cash earned nearly nothing. Meanwhile, SPY compounded at 14%+ annually.
The Statistical Credibility Problem#
One of the most sobering findings: two of the four "better" CAPE strategies are statistically meaningless.
| CAPE Strategy | Trigger Months in 32 Years | % of Time | Statistically Valid? |
|---|---|---|---|
| CAPE ≤ 15 | 5 months | 1.3% | No — far too few samples |
| CAPE ≤ 20 | 19 months | 4.9% | No — too few samples |
| CAPE ≤ 25 | 100 months | 26.0% | Borderline |
| CAPE ≤ 30 | 247 months | 64.3% | Yes |
CAPE≤15 ranked #2 with $1,125,046 — but that result came from 5 investment decisions in 32 years. The entire strategy's "success" rests on a handful of months at the 2008–2009 market bottom. That's not a strategy with a track record. It's luck from concentrated exposure to a single crash.
Any back-tested strategy that triggers fewer than 30 times over 32 years cannot be trusted as replicable evidence.
The Behavioral Test: Pain Periods#
Even if a strategy ultimately wins, can you actually hold it through years of underperformance?
We measured the longest consecutive stretch each strategy spent behind Monthly DCA.
| Strategy | Months Behind SIP | Years Behind SIP | % of Time Behind SIP |
|---|---|---|---|
| Crash Buyer −10% | 371 months | 30.9 years | 97.4% |
| Crash Buyer −20% | 371 months | 30.9 years | 97.4% |
| Below SMA-200 | 367 months | 30.6 years | 95.8% |
| Value Averaging | 328 months | 27.3 years | 94.3% |
| CAPE ≤ 20 | 155 months | 12.9 years | 77.6% |
| Faber 10-Month SMA | 80 months | 6.7 years | 21.9% |
| CAPE ≤ 25 | 60 months | 5.0 years | 18.0% |
Crash Buyer strategies spent 97.4% of all 384 months behind SIP. That means in 371 of 384 months, a friend using Monthly DCA had more money. The final portfolio value was worse AND the psychological experience was worse at almost every single checkpoint along the way.
CAPE≤20 investors spent 12.9 consecutive years behind SIP from 2013 to early 2026. Imagine watching the S&P 500 go from 1,800 to 5,800 and being poorer for it.
Faber's SMA strategy has the best behavioral profile: only 6.7 years of maximum consecutive underperformance and behind SIP only 21.9% of months.
Decade-by-Decade: Does Timing Ever Work?#
Some markets genuinely reward patience and punish overpayers. Let's see where CAPE timing would have helped.
The 1990s (1994–1999): Timing Fails From the Start#
CAPE started at 21.4 in 1994 and rose steadily. Every CAPE-timing strategy was forced to the sidelines as the market rallied 18–24% annually. SIP dominated this decade.
The 2000s (2000–2009): Timing's Best Decade#
This was CAPE timing's finest hour. The dot-com crash (CAPE peaked at 44) and the GFC crash (CAPE hit 13.9) created genuine valuation extremes. CAPE≤20 investors who had been accumulating cash from 1997–2003 got exceptional entry prices at the 2002–2003 bottom. This single decade is why CAPE timing has any academic credibility at all.
The 2010s (2010–2019): SIP's Decade#
The Fed's ZIRP policy kept cash yields near zero. CAPE never fell below 20 after 2013. Every dollar in cash earned essentially nothing while SPY compounded 13–14% annually. CAPE timers were decimated.
The 2020s (2020–2025): High-Rate Cash, Still Loses#
Cash finally earned 4–5% gross — but equity returns (28% in 2020, 27% in 2021, −18% in 2022, +26% in 2023, +23% in 2024) were so volatile and directionally positive that being out of the market hurt more than the cash earned.
The Theoretical Ceiling: Perfect Timer#
For context, we included a theoretically perfect timer — an investor with foreknowledge who invested only at the exact monthly trough of every bear market (2002, 2003, 2009, 2011, 2018, 2020, and others). This is impossible in practice.
- Final value: $1,137,488
- Advantage over Monthly DCA: +$152,894 (+15.5%)
- Deployed just 3% of the time (10 out of 384 months)
- Required sitting in cash for 71 consecutive months maximum
Even the theoretically perfect crash timer beat SIP by just 15.5% over 32 years. That's the absolute ceiling of what timing can deliver — and it required impossible foreknowledge.
No evidence-based strategy came close to that ceiling. The best real strategy (Faber) extracted just $7,526 of that $152,894 upside.
What Should an Investor Actually Do?#
Based on 32 years of data, here is the evidence-backed framework:
If you have a lump sum today (CAPE ~37)#
The data is honest: at CAPE ~37, the median 10-year forward return is +0.6% CAGR. The market is statistically likely to underperform its long-run average over the next decade. But:
- 57% of the time, the market still delivers positive 10-year returns
- The best case from CAPE ~37 was +5.9% CAGR over 10 years
- Sitting in cash earned 1.64%/year after taxes — below inflation in 7 of the last 10 years
- No model predicts when expensive markets correct or by how much
Practical approach: If you're investing new money every month, keep investing. If you have a large lump sum, consider deploying it over 12–24 months (not 16 years) via monthly tranches to reduce sequence-of-returns risk without the catastrophic opportunity cost of CAPE timing.
The only strategy that meaningfully improved on SIP#
Faber 10-Month SMA is the one rules-based improvement with real data support:
- Beat SIP by $7,526 over 32 years (modest but positive)
- Beat SIP in 11 of 12 twenty-year cohorts (much more consistent than CAPE strategies)
- Only sat out 18 months total — you're invested almost all the time
- Has a clear, mechanical rule that requires no valuation judgment
- Max consecutive months behind SIP: just 80 (vs. 155 for CAPE≤20)
The signal: at month-end, check if SPY's closing price is above or below its 10-month simple moving average. If above, invest. If below, park in money market.
What definitely doesn't work#
- Waiting for CAPE ≤ 20 — 16-year dry spell, $156K loss vs. SIP, statistically dubious
- Waiting for a 10–20% crash — spent 97% of all months behind SIP, $91–67K worse off
- CAPE-proportional sizing — reduced capital invested at precisely the wrong times, ended up worst of the "always invest" strategies at $877K
- Value averaging — near-identical to SIP with more complexity and no benefit
Methodology Notes#
- SPY prices: Adjusted close prices from our production database (8,288 trading days, 1994–2025)
- CAPE data: Shiller PE10 monthly data, hardcoded from academic anchor points and interpolated
- Fed Funds Rate: FRED FEDFUNDS series (monthly, 1954–2026)
- CPI: FRED CPIAUCSL series (monthly, 1947–2026), latest value 330.3
- Cash returns: Fed Funds rate applied monthly to cash reserves, simulating a money market fund
- Tax on cash: 37% marginal rate applied to interest income (conservative; your rate may vary)
- No transaction costs modeled (modern brokers charge $0 commissions; SPY has 0.0945% expense ratio)
- Contributions: $500 at start of each month, invested at that month's average price (OHLC mid-point)
- CAPE signal: Previous month's CAPE used (no look-ahead bias)
- Cohort analysis: 23 rolling 10-year windows (1994–2004 through 2016–2026), 27 rolling 5-year windows, 12 rolling 20-year windows
The Bottom Line#
The evidence is overwhelming. Here are the three things 32 years of data prove:
1. Monthly DCA is extremely hard to beat in practice. It ranked #5 of 12 strategies. The only strategies that beat it are either theoretically impossible (Perfect Timer), statistically invalid (CAPE≤15, 5 trigger months), or marginally better with a clearly defined rule (Faber, +$7K). Everything else lost.
2. Valuation timing is the most dangerous strategy a long-term investor can follow. CAPE≤20 is the investment approach that most financial content endorses as "prudent." In practice, it:
- Sat in cash for 16 consecutive years
- Deployed just 5% of capital over 32 years
- Earned 1.64% after-tax on cash while the market returned 11.9% CAGR
- Finished dead last out of 12 strategies with a $156K disadvantage
3. The real enemy is inflation, not bad timing choices. Even the best strategy delivered just 2.67% real CAGR after inflation. A portfolio that grew to $985K in nominal terms represents only $441K in 1994 purchasing power. The most important financial decision is to invest consistently in equities at all — the strategy you use is a second-order concern.
All backtest data is available for download. The simulation code and raw CSVs power our DCA Calculator tool. Try it with your own contribution amount and time horizon.
Have a question about the methodology or want to see a specific scenario tested? Use the analysis tools on VCP Scanner to explore SPY's historical return distribution from any starting CAPE level.