
VCP Pattern: The Volatility Contraction Before Nvidia's 2024 Run and Apple's 2020 Breakout
 Anish DasUpdated Nov 15, 20267 min read
VCPPattern guide · MinerviniLive setups: VCP Setups
- Pattern
- 2–6 contractions
- Each one tighter
- Final ≤ 10%
- Volume dries up
- Filters
- RS ≥ 70
- ≤ 25% off high
- > 50 & 200-day
- 200-day rising
On January 8, 2024, Nvidia closed at 52.25, above the 50.43 pivot of a base it had been building for 94 sessions. The three pullbacks inside that base had shrunk from 22.0% to 11.0% to 6.2%. Bought at that close with a stop under the last pullback's low, the trade risked 9.4%. By June 18 the stock was up 159.5%.
On June 3, 2020, Apple broke out of its COVID base the same way. Its four pullbacks measured 35.2%, 7.9%, 6.1% and 3.4%. The risk was 3.7%. Sixty-three sessions later the stock was up 65.1%.
Neither stock has traded at its stop since. A base whose pullbacks keep getting smaller until the stock breaks out is a volatility contraction pattern, or VCP. Here is how to read one, where the pivot and the stop go, and how to find the next one while it is still forming.
What $10,000 became#
$10,000 became$25,948
- Bought at the breakout's close
- 52.25
- Stop: the last contraction's low
- 47.32 (9.4% risk)
- Next session
- +1.7%
- Ten sessions later
- +14.6%
- Best close within 60 sessions
- +81.8%
- Best close within 120 sessions
- +159.5% (Jun 18, 2024)
- Reward for each $1 risked
- $16.90
- Stop hit since?
- Never
$10,000 became$16,508
- Bought at the breakout's close
- 81.28
- Stop: the last contraction's low
- 78.27 (3.7% risk)
- Next session
- −0.9%
- Ten sessions later
- +8.1%
- Best close within 60 sessions
- +55.7%
- Best close within 120 sessions
- +65.1% (Sep 1, 2020)
- Reward for each $1 risked
- $17.57
- Stop hit since?
- Never
Prices are split-adjusted, as on the chart.
The VCP in one table#
A VCP is a pause in an uptrend. The stock pulls back, recovers, and pulls back again, each time by less. Sellers are running out, and the price range tightens until a small push takes the stock through the high of the last pullback.
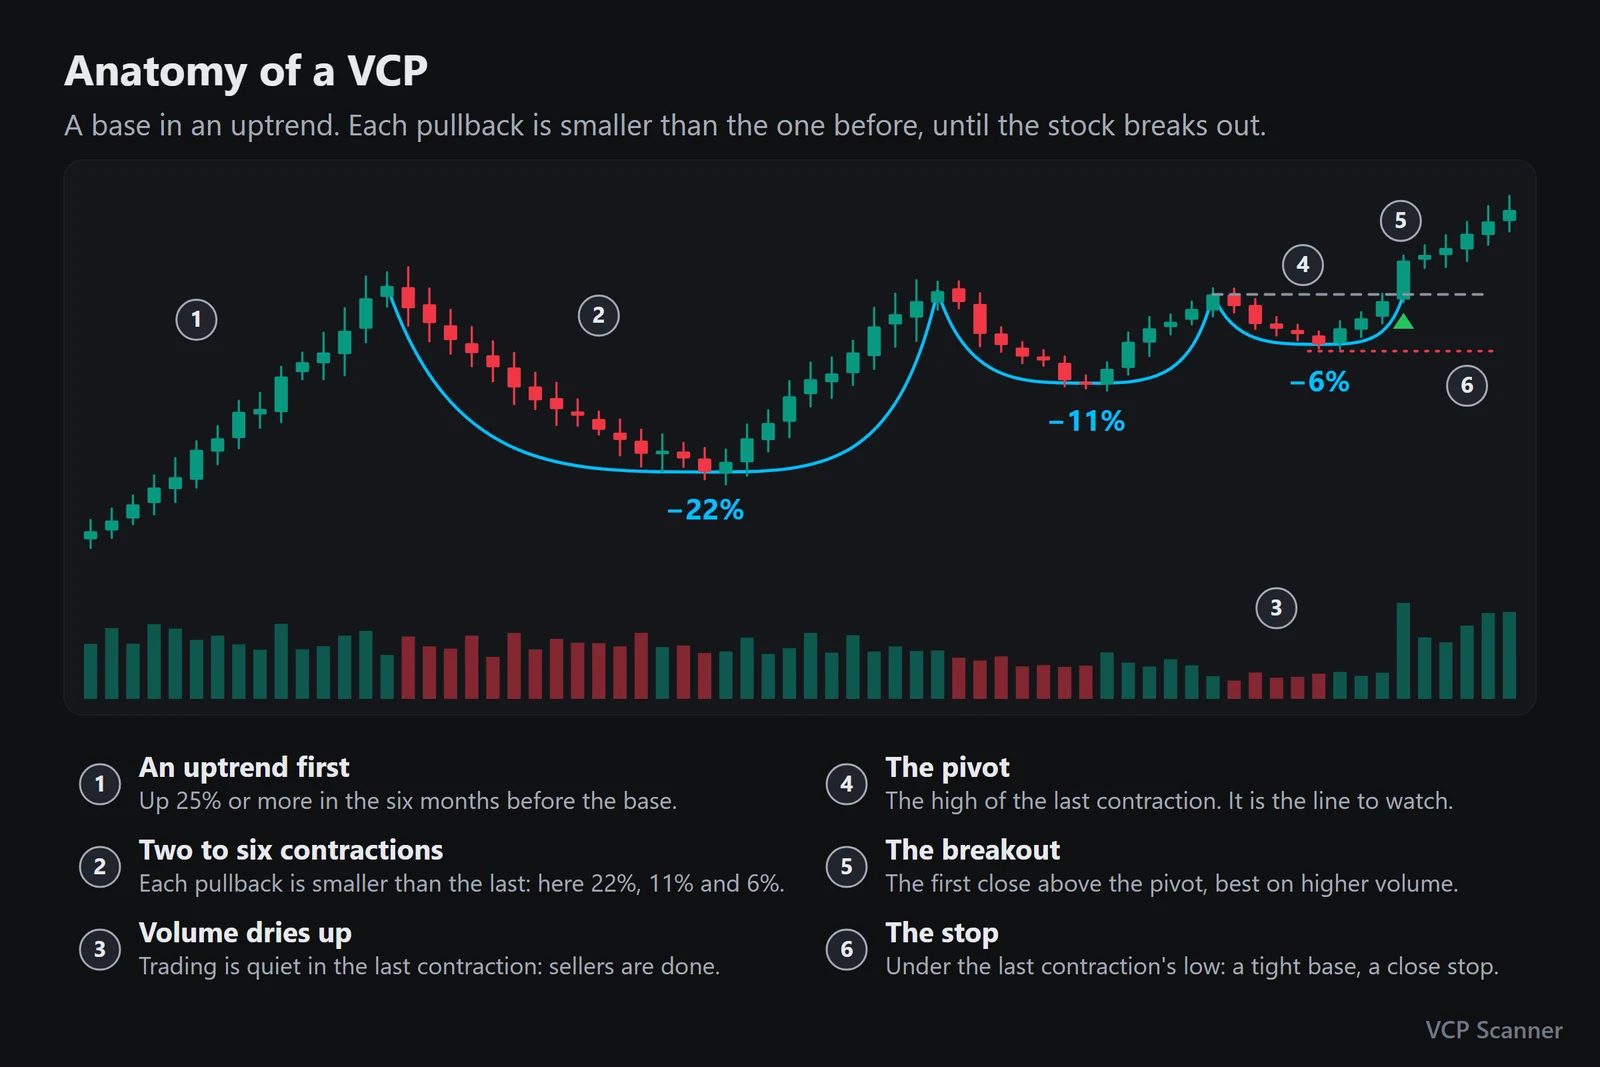
These are the rules VCP Scanner uses to name a VCP on a daily chart.
| Part | Rule |
|---|---|
| Trend before it | A Stage 2 uptrend. The stock gained at least 25% in the six months before the base's high, and that high is within 15% of the 52-week high |
| First contraction | 10% to 35% deep from the base's high, up to 50% when the whole market fell 15% or more |
| Later contractions | Each starts in the upper half of the base and is tighter than the one before |
| Number of contractions | Two to six |
| Final contraction | At most 10% deep, on volume no higher than the 50-day average |
| Pivot | The high of the final contraction, when it is within 5% of the base's top. Further below, the pivot is the top itself |
| Length | At least 25 sessions, five weeks, from the base's high to the breakout |
| Breakout | The first close above the pivot |
The terminal labels each VCP with its number of contractions: Nvidia's was a VCP 3T, Apple's a VCP 4T.
Example 1: Nvidia (NVDA) before its 2024 run, Jan 8, 2024#
NVDANvidia · Daily
Jan 8, 2024O 49.51H 52.28L 49.48C 52.25Vol 642.51M
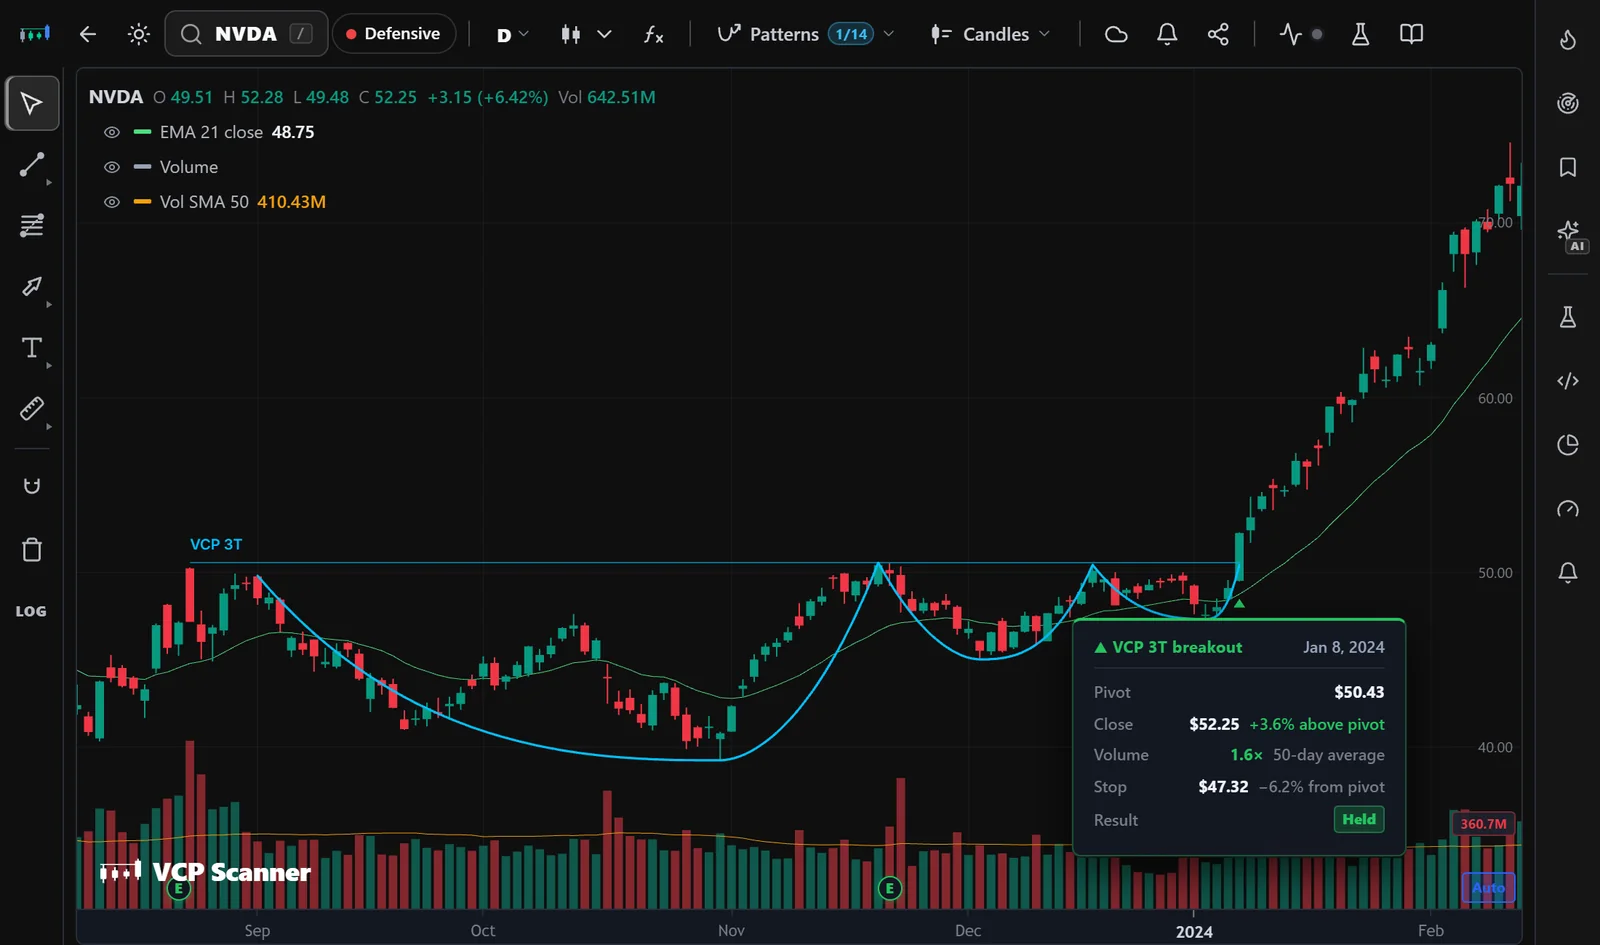
Daily prices, split-adjusted.
Open NVDA in the terminal| Fact | NVDA, Jan 8, 2024 |
|---|---|
| Base | Aug 24, 2023 to Jan 8, 2024: 94 sessions, 18.8 weeks |
| Contractions | 22.0%, 11.0%, 6.2% |
| Pivot | 50.43, the high of Dec 18, 2023 |
| Breakout day | Open 49.51, high 52.28, low 49.48, close 52.25: 3.6% above the pivot |
| Volume | 1.58× the 50-day average, after 0.76× during the last contraction |
| Stop | 47.32, the low of Jan 3, 2024 |
| Risk to stop | 9.4% |
What followed:
- Next session (Jan 9, 2024): 53.14, +1.7%.
- Ten sessions later (Jan 23, 2024): 59.87, +14.6%.
- Mar 25, 2024: 95.00, +81.8%, the best close within 60 sessions.
- Jun 18, 2024: 135.58, +159.5%. That is 16.9 times the 4.93 risked on each share.
- The stop at 47.32 was never hit. The stock has not traded below 51.69 since the breakout.
Two earnings gaps were part of the run: +11.2% on Feb 22, 2024 and +7.5% on May 23, 2024.
With $500 at risk, the stop sized the trade at 101 shares, about $5,277. At the Jun 18 close those shares were up $8,416.
The low of this base, on Oct 31, 2023, was a hammer: the second example of the hammer lesson.
Example 2: Apple (AAPL) out of its COVID base, Jun 3, 2020#
AAPLApple · Daily
Jun 3, 2020O 81.17H 81.55L 80.58C 81.28Vol 104.49M
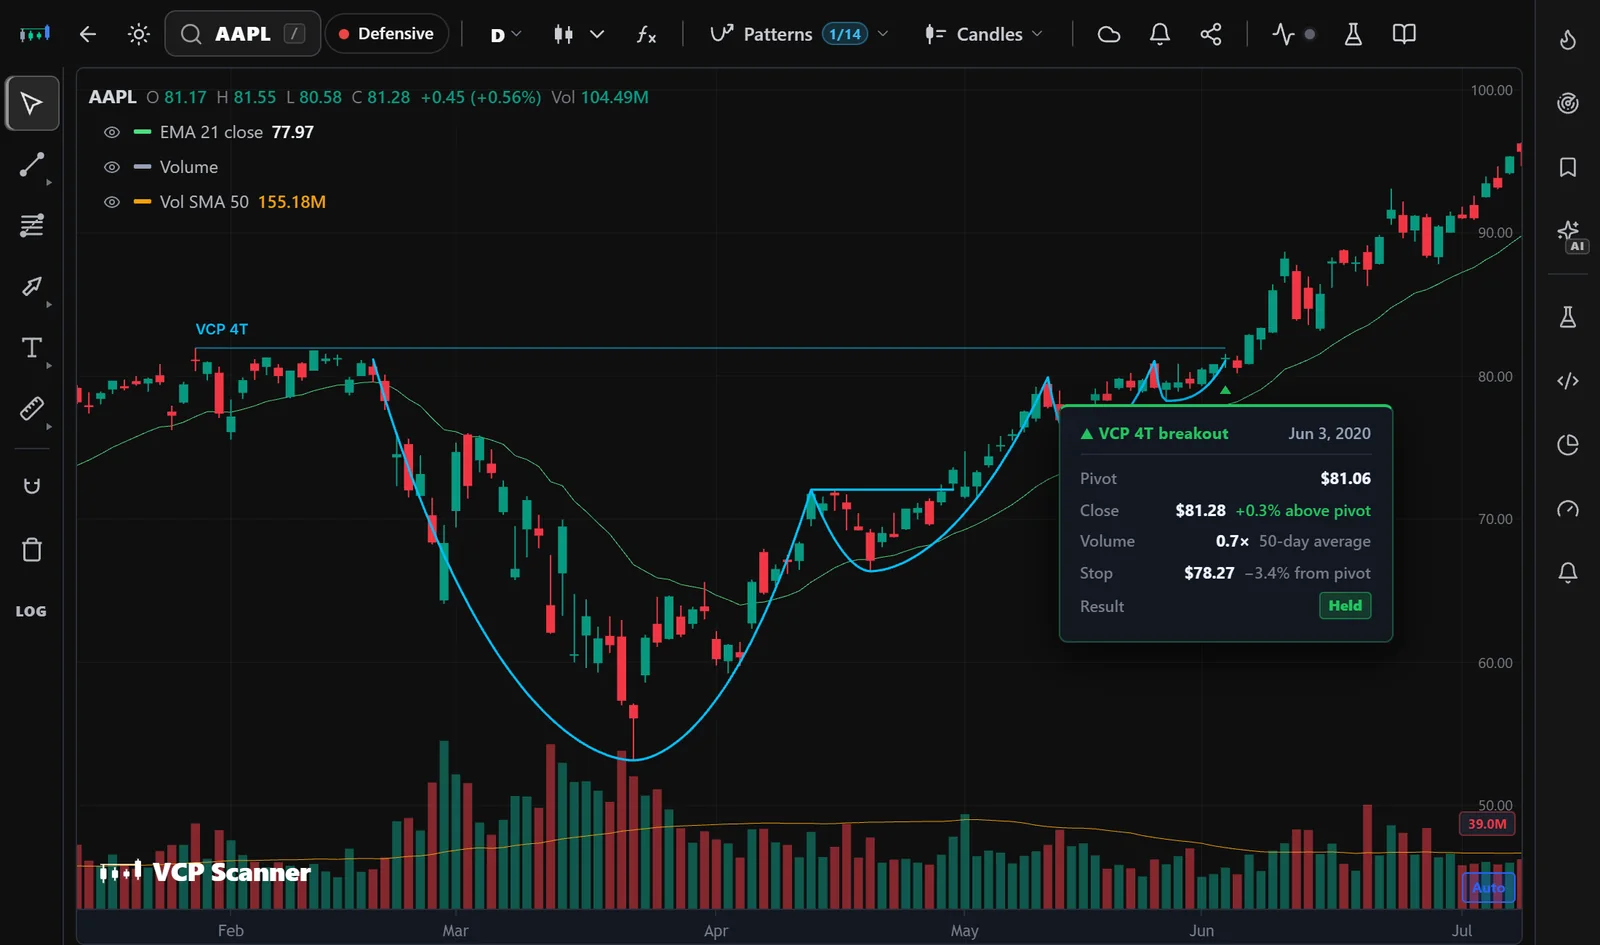
Daily prices, split-adjusted.
Open AAPL in the terminal| Fact | AAPL, Jun 3, 2020 |
|---|---|
| Base | Jan 29, 2020 to Jun 3, 2020: 88 sessions, 17.6 weeks |
| Contractions | 35.2%, 7.9%, 6.1%, 3.4% |
| Pivot | 81.06, the high of May 26, 2020 |
| Breakout day | Open 81.17, high 81.55, low 80.58, close 81.28: 0.3% above the pivot |
| Volume | 0.65× the 50-day average, after 0.62× during the last contraction |
| Stop | 78.27, the low of May 27, 2020 |
| Risk to stop | 3.7% |
What followed:
- Next session (Jun 4, 2020): 80.58, −0.9%. It stayed above the stop.
- Ten sessions later (Jun 17, 2020): 87.90, +8.1%.
- Aug 26, 2020: 126.52, +55.7%, the best close within 60 sessions.
- Sep 1, 2020: 134.18, +65.1%. That is 17.6 times the 3.01 risked on each share.
- The stop at 78.27 was never hit. The stock has not traded below 80.19 since the breakout.
One earnings gap was part of the run: +7.0% on Jul 31, 2020.
With $500 at risk, the stop sized the trade at 166 shares, about $13,492. At the Sep 1 close those shares were up $8,781.
Apple's first contraction was 35.2% because the whole market fell in March 2020. Its low, on Mar 23, 2020, was also a hammer: the first example of the hammer lesson.
How to trade a VCP#
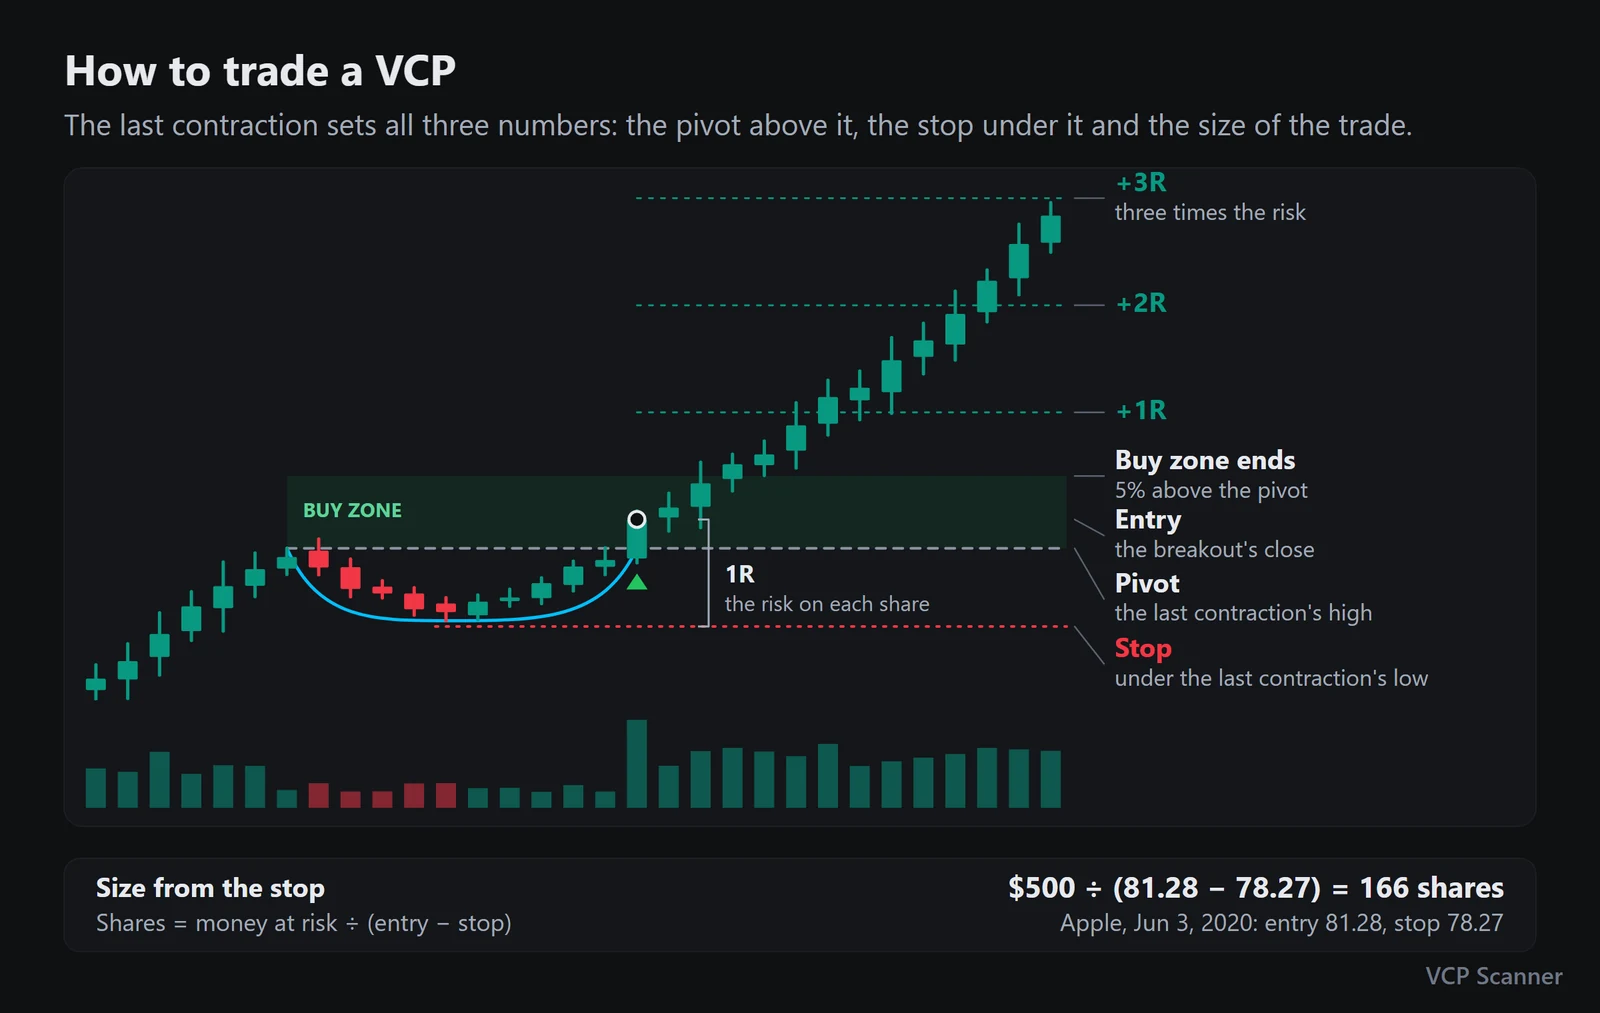
- Start with the trend. A VCP is a pause in an uptrend, not a bottom. Nvidia had gained more than 25% in the six months before its base's high, and so had Apple.
- Count the contractions. Each one has to be tighter than the one before. Nvidia: 22.0%, 11.0%, 6.2%. Apple: 35.2%, 7.9%, 6.1%, 3.4%.
- Mark the pivot. It is the high of the last contraction: 50.43 on Nvidia, 81.06 on Apple.
- Buy the breakout inside the buy zone. The breakout is the first close above the pivot, and the buy zone runs from the pivot to 5% above it. Nvidia closed 3.6% above its pivot, Apple 0.3%.
- Put the stop under the last contraction's low. A tight last contraction means a close stop: 47.32 on Nvidia, 78.27 on Apple. VCP Scanner's setup cards never show a stop more than 8% under the pivot.
- Size from the stop. Shares = money at risk ÷ (entry − stop). On Apple, $500 ÷ (81.28 − 78.27) is 166 shares.
When a VCP fails#
VCP Scanner marks a breakout as failed when, within 25 sessions, the stock does one of three things:
- closes below the low of the whole base;
- closes 8% or more below the pivot;
- closes 3% below the pivot before it has run 5% above it.
The third one comes first in time: a stock that closes back under its pivot before it has gone anywhere. The stop under the last contraction's low is still the line that ends the trade.
Find VCPs in VCP Scanner#
- Live setups. The VCP Setups playbook lists the VCPs the scanner reads in confirmed uptrends, in tabs by distance to the pivot: broke out today, above the pivot, at the pivot and near the pivot. A few setups in each tab are free. Pro shows all of them.
- On any chart. Open a stock in the terminal, for example NVDA or AAPL. Patterns in the chart toolbar draws every VCP on the chart, past and present: its contractions, and a mark under each breakout.
- The breakout's facts. Point at the mark under a breakout for its pivot, its close, its volume against the 50-day average, its stop and whether it held.
- The record. The playbook's Track record tab lists the VCPs that were on the page before they broke out, with what became of each one.
Bottom line#
- A VCP is a base in an uptrend whose pullbacks get smaller, two to six of them, until the stock closes above the high of the last one.
- Nvidia's VCP of Jan 8, 2024 risked 9.4% and ran 159.5% in 112 sessions. Apple's of Jun 3, 2020 risked 3.7% and ran 65.1% in 63.
- The last contraction's low is the stop. It defines the risk before the trade.
Data: VCPScanner daily market data through Nov 13, 2026, split-adjusted. The examples are for education, not recommendations.
Quick answers
What is a VCP pattern?
A volatility contraction pattern is a base in an uptrend whose pullbacks get smaller from left to right, until the stock breaks out above the high of the last one. Nvidia's base before its January 2024 breakout pulled back 22.0%, then 11.0%, then 6.2%.
How many contractions does a VCP have?
Two to six. Nvidia's 2024 VCP had three and Apple's 2020 VCP had four. Each one is tighter than the one before, and the last is at most 10% deep.
Where is the pivot of a VCP?
At the high of the last contraction. Nvidia's pivot was 50.43, the high of Dec 18, 2023, and the breakout was the first close above it, on Jan 8, 2024.
Where does the stop go on a VCP?
Under the low of the last contraction. On Nvidia that was 47.32, a 9.4% risk from the breakout's close. On Apple it was 78.27, a 3.7% risk.
Does a VCP breakout need high volume?
Volume above the 50-day average shows demand, and Nvidia's breakout came on 1.58 times its average. Apple's came on 0.65 times and still ran 65.1% in 63 sessions, so the tight final contraction mattered more than the volume that day.
All 44 candles on one cheat sheet.
Enter your email and download it right away. You also get our weekly market brief, every Friday.