
69 stocks · 0 setups today · as of Nov 20, 2026
| Stock | Industry | Tier | Watchlist | |||||
|---|---|---|---|---|---|---|---|---|
 BHPBHP Group Limited | — | -2.00% | $67.18 | 48 | $170.66B | Copper & Diversified Miners | Major | |
 RIORio Tinto Group | — | -2.64% | $72.73 | 40 | $118.19B | Copper & Diversified Miners | Major | |
 SCCOSouthern Copper Corporation | — | -5.26% | $134.02 | 37 | $114.36B | Copper & Diversified Miners | Core | |
 FCXFreeport-McMoRan Inc. | — | -6.36% | $46.00 | 37 | $66.12B | Copper & Diversified Miners | Core | |
 VALEVale S.A. | — | -3.46% | $9.49 | 28 | $40.47B | Copper & Diversified Miners | Major | |
 CCJCameco Corporation | — | -5.58% | $58.00 | 23 | $25.26B | Uranium | Core | |
 TECKTeck Resources Limited | — | -5.98% | $48.50 | 46 | $23.42B | Copper & Diversified Miners | Core | |
 SQMSociedad Química y Minera de Chile S.A. | — | -1.84% | $46.97 | 27 | $13.42B | Lithium & Rare Earths | Core | |
 ALBAlbemarle Corporation | — | -3.89% | $79.70 | 21 | $9.4B | Lithium & Rare Earths | Core | |
 AAAlcoa Corporation | — | -5.29% | $33.40 | 30 | $8.81B | Steel & Aluminum | Major | |
 HBMHudbay Minerals Inc. | — | -6.28% | $16.20 | 32 | $7.19B | Copper & Diversified Miners | Core | |
 MPMP Materials Corp. | — | -7.39% | $33.95 | 23 | $6.04B | Lithium & Rare Earths | Core | |
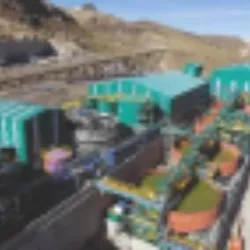 BVNCompañía de Minas Buenaventura S.A.A. | — | -7.63% | $19.61 | 26 | $4.98B | Gold Miners | Major | |
 NXENexGen Energy Ltd. | — | -7.50% | $6.41 | 26 | $4.24B | Uranium | Core | |
 CGAUCenterra Gold Inc. | — | -6.64% | $16.74 | 59 | $3.27B | Gold Miners | Major | |
 CENXCentury Aluminum Company | — | -6.96% | $28.32 | 30 | $2.8B | Steel & Aluminum | Core | |
 UECUranium Energy Corp. | — | -7.99% | $5.30 | 14 | $2.62B | Uranium | Core | |
 EROEro Copper Corp. | — | -8.05% | $21.47 | 34 | $2.24B | Copper & Diversified Miners | Core | |
 TGBTrekor Metals Limited | — | -4.55% | $5.36 | 39 | $1.96B | Copper & Diversified Miners | Core | |
 PPTAPerpetua Resources Corp. | — | -6.21% | $14.51 | 22 | $1.82B | Gold Miners | Major | |
 USARUSA Rare Earth Inc | — | -8.73% | $6.27 | 11 | $1.8B | Lithium & Rare Earths | Core | |
 AXTIAXT, Inc. | — | -12.26% | $30.57 | 75 | $1.55B | Semiconductor Equipment & Materials | Major | |
 DNNDenison Mines Corp. | — | -7.18% | $1.68 | 20 | $1.52B | Uranium | Core | |
 NEXANexa Resources S.A. | — | -4.82% | $9.48 | 45 | $1.26B | Copper & Diversified Miners | Major | |
 UUUUEnergy Fuels Inc. | — | -8.76% | $5.00 | 8 | $1.25B | Uranium | Core | |
 SLSRSolaris Resources Inc | — | -6.39% | $5.13 | 25 | $857M | Copper & Diversified Miners | Core | |
 IEIvanhoe Electric Inc. | — | -6.51% | $5.39 | 15 | $852M | Copper & Diversified Miners | Core | |
 TMCTMC the metals company inc. | — | -9.04% | $1.51 | 8 | $654M | Copper & Diversified Miners | Core | |
 LARLithium Argentina AG | — | -5.30% | $3.04 | 16 | $498M | Lithium & Rare Earths | Core | |
 SGMLSigma Lithium Corporation | — | -9.34% | $3.69 | 8 | $411M | Lithium & Rare Earths | Core | |
 GSMFerroglobe PLC | — | -7.83% | $2.12 | 19 | $399M | Steel & Aluminum | Major | |
 CRMLCritical Metals Corp. | — | -13.22% | $3.02 | 12 | $398M | Lithium & Rare Earths | Core | |
 ISOUIsoEnergy Ltd. | — | -6.67% | $5.60 | 21 | $365M | Uranium | Major | |
 LZMLifezone Metals Limited | — | -8.27% | $3.88 | 54 | $354M | Copper & Diversified Miners | Core | |
 UAMYUnited States Antimony Corporation | — | -6.30% | $2.23 | 11 | $330M | Lithium & Rare Earths | Core | |
 NBNioCorp Developments Ltd. | — | -10.61% | $2.19 | 15 | $319M | Lithium & Rare Earths | Core | |
 METCRamaco Resources, Inc. | — | -8.92% | $5.41 | 12 | $291M | Coal | Major | |
 LACLithium Americas Corp. | — | -5.26% | $1.26 | 9 | $281M | Lithium & Rare Earths | Core | |
 WRNWestern Copper and Gold Corporation | — | -7.25% | $1.22 | 17 | $274M | Copper & Diversified Miners | Core | |
 TMQTrilogy Metals Inc. | — | -11.43% | $1.55 | 13 | $268M | Copper & Diversified Miners | Core | |
 ALOYREalloys Inc. | — | -13.10% | $3.78 | 12 | $261M | Lithium & Rare Earths | Core | |
 SLIStandard Lithium Ltd. | — | -9.09% | $1.00 | 9 | $244M | Lithium & Rare Earths | Core | |
 METCBRamaco Resources, Inc. | — | -8.58% | $2.77 | 9 | $236M | Coal | Major | |
 NAKNorthern Dynasty Minerals Ltd. | — | -18.64% | $0.42 | 6 | $233M | Copper & Diversified Miners | Core | |
 NMGNouveau Monde Graphite Inc. | — | -7.12% | $0.67 | 12 | $221M | Lithium & Rare Earths | Core | |
 URGUr-Energy Inc. | — | -5.41% | $0.46 | 9 | $181M | Uranium | Core | |
 ASPIASP Isotopes Inc. Common Stock | — | -3.51% | $1.10 | 5 | $138M | Medical Imaging & Radiation | Major | |
 IONRioneer Ltd | — | -3.51% | $2.20 | 24 | $138M | Lithium & Rare Earths | Core | |
 ARECAmerican Resources Corporation | — | +2.02% | $0.91 | 11 | $97M | Lithium & Rare Earths | Major | |
 EUenCore Energy Corp. | — | -6.83% | $0.44 | 7 | $86M | Uranium | Core | |
 ABATAmerican Battery Technology Company Common Stock | — | -9.67% | $0.79 | 7 | $83M | Lithium & Rare Earths | Core | |
 SOWGSow Good Inc. | — | +3.95% | $2.37 | 33 | $48M | Packaged Foods | Major | |
 ELBMElectra Battery Materials Corporation | — | -15.16% | $0.33 | 18 | $44M | Lithium & Rare Earths | Core | |
 WWRWestwater Resources, Inc. | — | -10.49% | $0.33 | 18 | $42M | Lithium & Rare Earths | Core | |
 ATLXAtlas Lithium Corporation | — | -10.53% | $1.36 | 10 | $40M | Lithium & Rare Earths | Core | |
 ELVRElevra Lithium Limited | — | -3.78% | $20.62 | 12 | $40M | Lithium & Rare Earths | Core | |
 NVXNovonix Limited | — | -2.94% | $1.84 | 25 | $39M | Lithium & Rare Earths | Major | |
 AECAnfield Energy Inc. Common Shares | — | -10.50% | $2.13 | 14 | $39M | Uranium | Core | |
 FEAM5E Advanced Materials Inc. | — | -4.52% | $1.48 | 38 | $35M | Lithium & Rare Earths | Core | |
 IPXIperionX Limited | — | -12.17% | $9.96 | 11 | $33M | Steel & Aluminum | Core | |
 NEXMNexmetals Mining Corp. | — | -4.58% | $0.81 | 7 | $29M | Copper & Diversified Miners | Core | |
 OMEXOdyssey Marine Exploration, Inc. | — | -15.70% | $6.39 | 5 | $15M | Copper & Diversified Miners | Core | |
 KAZRSkyline Builders Group Holding Ltd. Class A | — | +10.48% | $0.82 | 11 | $14M | Engineering & Construction | Major | |
 LGOLargo Inc. | — | -3.50% | $0.19 | 5 | $14M | Lithium & Rare Earths | Core | |
 FMSTForemost Clean Energy Ltd. | — | -10.87% | $0.54 | 11 | $7M | Uranium | Major | |
 NVANova Minerals Limited | — | -13.04% | $2.00 | 9 | $6M | Gold Miners | Major | |
 EPOWE-Power Inc. Class A | — | -4.08% | $3.05 | 31 | $4M | Lithium & Rare Earths | Core | |
 AQMSAqua Metals, Inc. | — | -33.31% | $0.65 | 4 | $2M | Lithium & Rare Earths | Core | |
 SDSTStardust Power Inc. | — | -2.99% | $0.01 | 1 | $68768 | Lithium & Rare Earths | Core |
Critical Minerals Stocks -52.6%SPY -9.9%
Equal-weight return of the theme's stocks from the range start, against SPY. Daily market data.
| Window | Theme | SPY | vs SPY |
|---|---|---|---|
| Today | -7.3% | -3.6% | -3.6% |
| 5D | -14.4% | -6.8% | -7.6% |
| 1M | -31.0% | -10.8% | -20.2% |
| 3M | -52.6% | -9.9% | -42.7% |
| 6M | -54.7% | -7.1% | -47.6% |
| YTD | -49.2% | +1.2% | -50.4% |
| 1Y | -34.1% | +4.7% | -38.8% |
Copper, lithium, rare earths, uranium, and strategic materials powering electrification, defense, and supply-chain security.
Research US-listed critical minerals stocks across copper, lithium, rare earths, uranium, aluminum, steel, and strategic materials tied to electrification, defense, and supply-chain security.
69 US-listed stocks, placed in this theme by our own classification of each company's business. Setups come from the same chart-pattern engine as the breakout page and update after the close.
The digital and electrified economy still depends on mines, permits, processing, and supply chains.
Critical minerals sit underneath many of the market themes investors care about: AI power demand, electric vehicles, grid modernization, nuclear energy, defense systems, and domestic manufacturing. When supply is tight or policy support rises, miners and materials companies can become direct beneficiaries.
This page keeps those exposures together while separating established producers from higher-risk developers.
Commodity exposure matters, but asset quality and balance sheets decide survivability.
Start by separating producers from developers. Producers can generate cash when commodity prices are favorable. Developers can offer more upside but often depend on permitting, financing, and construction execution before revenue arrives. Diversified miners require a view on commodity mix and capital allocation.
Use market cap, debt, margins, and return history to judge whether the market is rewarding the commodity exposure or discounting execution risk.
Commodity exposure can create powerful upside and brutal drawdowns.
Critical minerals can be powerful thematic stocks, but they are not simple compounders. Commodity prices, mine costs, reserve quality, permitting, jurisdiction, financing, and balance sheets can dominate results.
The theme works best when investors know whether they own a cash-generating producer, a cyclical commodity trade, or a project developer that still needs capital and approvals.
Critical minerals stocks are companies producing or developing materials important to electrification, defense, energy security, batteries, infrastructure, nuclear power, and industrial supply chains.
Gold and precious metals are often store-of-value or monetary hedges. Critical minerals are more tied to industrial demand, electrification, and supply-chain security.
Uranium is a strategic energy input and overlaps with nuclear power, which is increasingly tied to energy security and AI power demand.
Yes. Many are sensitive to commodity prices, project timelines, financing conditions, permitting, jurisdiction, and government policy. Developers are usually riskier than established producers.
Start with market cap, margins, debt, return history, valuation, and the specific commodity exposure. Then separate producers with cash flow from developers that still need permits, financing, and construction execution.
They serve different end markets, but all are tied to strategic supply chains. Copper supports grids and electrification, lithium supports batteries, uranium supports nuclear power, and rare earths support magnets, defense, and advanced manufacturing.
The biggest mistake is buying the long-term commodity thesis without checking company quality. A weak balance sheet, high-cost asset, bad jurisdiction, or delayed project can underperform even when the commodity story is attractive.