
74 stocks · 0 setups today · as of Nov 20, 2026
| Stock | Industry | Tier | Watchlist | |||||
|---|---|---|---|---|---|---|---|---|
 NEMNewmont Corporation | — | -5.37% | $94.68 | 45 | $99.76B | Gold Miners | Core | |
 AEMAgnico Eagle Mines Limited | — | -4.39% | $151.30 | 38 | $76.61B | Gold Miners | Core | |
 BBarrick Mining Corporation | — | -5.48% | $31.54 | 34 | $52.85B | Gold Miners | Core | |
 WPMWheaton Precious Metals Corp. | — | -5.36% | $109.91 | 42 | $49.91B | Precious Metal Royalties | Core | |
 FNVFranco-Nevada Corporation | — | -3.31% | $223.21 | 56 | $43.05B | Precious Metal Royalties | Core | |
 AUAngloGold Ashanti plc | — | -5.92% | $72.43 | 33 | $36.63B | Gold Miners | Core | |
 GFIGold Fields Limited | — | -3.41% | $31.60 | 33 | $28.28B | Gold Miners | Core | |
 KGCKinross Gold Corporation | — | -5.10% | $17.32 | 23 | $20.68B | Gold Miners | Core | |
 RGLDRoyal Gold, Inc. | — | -4.10% | $222.03 | 57 | $18.84B | Precious Metal Royalties | Core | |
 PAASPan American Silver Corp. | — | -5.50% | $30.61 | 25 | $12.9B | Silver Miners | Core | |
 CDECoeur Mining, Inc. | — | -7.45% | $10.68 | 22 | $11.01B | Gold Miners | Core | |
 AGIAlamos Gold Inc. | — | -4.24% | $24.87 | 28 | $10.44B | Gold Miners | Core | |
 IAGIamgold Corporation | — | -5.19% | $14.44 | 40 | $8.35B | Gold Miners | Core | |
 HMYHarmony Gold Mining Company Limited | — | -4.97% | $12.82 | 29 | $8.01B | Gold Miners | Core | |
 HBMHudbay Minerals Inc. | — | -6.28% | $16.20 | 32 | $7.19B | Copper & Diversified Miners | Major | |
 HLHecla Mining Company | — | -5.74% | $10.51 | 23 | $7.05B | Silver Miners | Core | |
 EQXEquinox Gold Corp. | — | -5.57% | $8.39 | 26 | $6.62B | Gold Miners | Core | |
 SBSWSibanye Stillwater Limited | — | -6.21% | $7.25 | 23 | $5.82B | Gold Miners | Core | |
 OROR Royalties Inc. | — | -3.31% | $30.40 | 43 | $5.7B | Precious Metal Royalties | Core | |
 TFPMTriple Flag Precious Metals Corp. | — | -2.81% | $26.96 | 42 | $5.57B | Precious Metal Royalties | Core | |
 BTGB2Gold Corp. | — | -5.29% | $4.12 | 44 | $5.49B | Gold Miners | Core | |
 AGFirst Majestic Silver Corp. | — | -3.62% | $10.91 | 24 | $5.38B | Silver Miners | Core | |
 EGOEldorado Gold Corporation | — | -7.79% | $24.75 | 30 | $5.27B | Gold Miners | Core | |
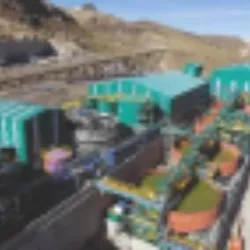 BVNCompañía de Minas Buenaventura S.A.A. | — | -7.63% | $19.61 | 26 | $4.98B | Gold Miners | Core | |
 AUGOAura Minerals | — | -6.51% | $57.05 | 50 | $4.78B | Gold Miners | Core | |
 SSRMSSR Mining Inc. | — | -7.30% | $21.59 | 34 | $4.48B | Gold Miners | Core | |
 CGAUCenterra Gold Inc. | — | -6.64% | $16.74 | 59 | $3.27B | Gold Miners | Core | |
 SKESkeena Resources Limited | — | -7.71% | $23.83 | 45 | $2.96B | Gold Miners | Core | |
 ARISAris Mining Corporation | — | -5.49% | $12.04 | 32 | $2.49B | Gold Miners | Core | |
 AAUCAllied Gold Corporation | — | -4.25% | $17.80 | 38 | $2.25B | Gold Miners | Core | |
 FSMFortuna Mining Corp. | — | -7.80% | $7.33 | 32 | $2.22B | Gold Miners | Core | |
 NGNovaGold Resources Inc. | — | -2.91% | $4.67 | 20 | $2.05B | Gold Miners | Core | |
 PPTAPerpetua Resources Corp. | — | -6.21% | $14.51 | 22 | $1.82B | Gold Miners | Core | |
 SASeabridge Gold Inc. | — | -7.70% | $16.67 | 21 | $1.79B | Gold Miners | Core | |
 EXKEndeavour Silver Corp. | — | -6.74% | $5.67 | 23 | $1.68B | Silver Miners | Core | |
 SVMSilvercorp Metals Inc. | — | -8.26% | $6.66 | 28 | $1.47B | Silver Miners | Core | |
 HYMCHycroft Mining Holding Corporation | — | -8.49% | $12.61 | 23 | $1.18B | Gold Miners | Core | |
 CNLCollective Mining Ltd. | — | -6.30% | $9.66 | 30 | $896M | Gold Miners | Core | |
 IAUXi-80 Gold Corp. | — | -1.90% | $1.03 | 29 | $888M | Gold Miners | Core | |
 VZLAVizsla Silver Corp. | — | -10.99% | $2.51 | 28 | $877M | Silver Miners | Core | |
 NEWPNew Pacific Metals Corp. | — | -10.17% | $4.15 | 58 | $764M | Silver Miners | Core | |
 ELEElemental Royalty Corporation Common Stock | — | -8.63% | $11.33 | 26 | $729M | Precious Metal Royalties | Core | |
 USASAmericas Gold and Silver Corporation | — | -8.54% | $1.88 | 11 | $633M | Silver Miners | Core | |
 GROYGold Royalty Corp. | — | -1.17% | $2.54 | 33 | $606M | Precious Metal Royalties | Core | |
 OGGOsisko Gold Group Inc. | — | 0.00% | $1.89 | 25 | $597M | Gold Miners | Core | |
 ASMAvino Silver & Gold Mines Ltd. | — | -5.75% | $3.44 | 20 | $585M | Silver Miners | Core | |
 DCDakota Gold Corp. | — | -5.73% | $4.11 | 37 | $550M | Gold Miners | Core | |
 MUXMcEwen Mining Inc. | — | -4.63% | $9.17 | 15 | $548M | Gold Miners | Core | |
 MTAMetalla Royalty & Streaming Ltd. | — | -6.11% | $5.84 | 33 | $546M | Precious Metal Royalties | Core | |
 GAUGaliano Gold Inc. | — | -4.97% | $1.72 | 34 | $449M | Gold Miners | Core | |
 VGZVista Gold Corp. | — | -1.93% | $2.29 | 66 | $334M | Gold Miners | Core | |
 CMCLCaledonia Mining Corporation Plc | — | -8.75% | $16.26 | 27 | $314M | Gold Miners | Core | |
 CTGOContango Ore, Inc. | — | -5.13% | $9.43 | 15 | $305M | Gold Miners | Core | |
 THMInternational Tower Hill Mines Ltd. | — | -7.72% | $1.14 | 18 | $297M | Gold Miners | Core | |
 ITRGIntegra Resources Corp. | — | -5.30% | $1.43 | 18 | $290M | Gold Miners | Core | |
 NFGCNew Found Gold Corp. | — | +1.72% | $1.18 | 23 | $289M | Gold Miners | Core | |
 WRNWestern Copper and Gold Corporation | — | -7.25% | $1.22 | 17 | $274M | Copper & Diversified Miners | Major | |
 VOXRVox Royalty Corp. | — | -5.75% | $3.77 | 33 | $260M | Precious Metal Royalties | Core | |
 NAKNorthern Dynasty Minerals Ltd. | — | -18.64% | $0.42 | 6 | $233M | Copper & Diversified Miners | Major | |
 TRXTRX Gold Corporation | — | -6.12% | $0.68 | 27 | $221M | Gold Miners | Core | |
 GOROGoldgroup Mining Inc. | — | +2.10% | $2.92 | 42 | $220M | Gold Miners | Core | |
 IDRIdaho Strategic Resources, Inc. | — | -8.10% | $13.85 | 14 | $219M | Gold Miners | Core | |
 DRDDRDGOLD Limited | — | -3.19% | $20.02 | 30 | $174M | Gold Miners | Core | |
 GLDGGoldMining Inc. | — | -0.03% | $0.62 | 18 | $132M | Gold Miners | Core | |
 USAUU.S. Gold Corp. | — | -8.09% | $7.73 | 18 | $128M | Gold Miners | Core | |
 PLGPlatinum Group Metals Ltd. | — | -10.44% | $0.77 | 15 | $99M | Gold Miners | Core | |
 PZGParamount Gold Nevada Corp. | — | -4.22% | $0.90 | 24 | $77M | Gold Miners | Core | |
 FURYFury Gold Mines Limited | — | +0.77% | $0.39 | 28 | $75M | Gold Miners | Core | |
 USGOU.S. GoldMining Inc. | — | -9.85% | $3.66 | 12 | $49M | Gold Miners | Core | |
 NAMMNamib Minerals | — | -1.46% | $0.62 | 11 | $34M | Gold Miners | Core | |
 XPLSolitario Zinc Corp. | — | -6.42% | $0.35 | 17 | $33M | Gold Miners | Core | |
 AUSTAustin Gold Corp. | — | -8.58% | $0.53 | 12 | $7M | Gold Miners | Core | |
 NVANova Minerals Limited | — | -13.04% | $2.00 | 9 | $6M | Gold Miners | Core | |
 BGLBlue Gold Limited | — | -20.43% | $0.07 | 4 | $736535 | Gold Miners | Core |
Gold & Precious Metals Stocks -41.6%SPY -9.9%
Equal-weight return of the theme's stocks from the range start, against SPY. Daily market data.
| Window | Theme | SPY | vs SPY |
|---|---|---|---|
| Today | -6.0% | -3.6% | -2.3% |
| 5D | -15.0% | -6.8% | -8.2% |
| 1M | -27.3% | -10.8% | -16.5% |
| 3M | -41.6% | -9.9% | -31.7% |
| 6M | -35.5% | -7.1% | -28.4% |
| YTD | -33.8% | +1.2% | -35.0% |
| 1Y | -17.0% | +4.7% | -21.7% |
Senior gold miners, silver producers, royalty and streaming companies, and precious metals across the mining stack.
Gold and precious metals stocks tracked across senior miners, silver producers, royalty companies, and critical minerals with daily updated market data, valuation metrics and performance tracking.
74 US-listed stocks, placed in this theme by our own classification of each company's business. Setups come from the same chart-pattern engine as the breakout page and update after the close.
Central bank buying, de-dollarization, and real rate sensitivity have combined to push gold to all-time highs.
Gold equities offer operating leverage: if NEM produces at $1,200 AISC and gold trades at $2,400, the spread drives free cash flow — and if gold moves to $2,700, the spread widens 25% while the stock often moves more. This leverage works in reverse when gold falls, making AISC the primary quality filter. The current cycle is supported by central bank buying at multi-decade highs and elevated geopolitical risk as non-Western reserves diversify away from US Treasuries. Royalty companies capture the same upside with less downside by eliminating operating cost exposure entirely.
All-in sustaining cost, reserve life, and balance sheet quality determine quality at any gold price.
AISC per gold equivalent ounce is the quality filter: a miner at $1,150 AISC earns twice the free cash flow margin of one at $1,700 at the same spot price. Reserve life determines how long production can sustain without new discoveries; check both alongside balance sheet strength. Royalty companies are simpler — compare revenue growth, producing vs. development-stage royalty count, and geographic diversification. NAV at flat, bull, and bear gold price assumptions is the standard valuation framework for operators and royalty companies alike.
Operating risk, geopolitical mine location, and gold price cyclicality are the three most common sources of underperformance.
Gold equities carry significant cyclical risk: in prolonged bear markets, miners with high AISC can lose 60-70% of their market cap. Geopolitical jurisdiction risk is material — many of the world's best deposits are in West Africa, Latin America, and other politically complex regions. Cost inflation is the hidden margin killer: when oil, labor, or equipment costs rise, AISC moves up and free cash flow stalls even if gold holds flat. Royalty companies sidestep this entirely — they receive a fixed production percentage regardless of operator spend, which is why WPM and FNV trade at premium multiples.
Companies whose revenue or earnings are materially driven by gold or silver production, precious metals royalties and streaming agreements, or exposure to critical minerals with monetary or industrial demand. Spans senior gold miners (NEM, AEM), silver producers (PAAS, HL), royalty companies (WPM, FNV, RGLD), mid-tier and junior miners (BTG, EGO, IAG), and diversified miners with gold by-product (FCX, TECK).
Agnico Eagle (AEM) is widely regarded as the highest-quality senior gold miner — low-cost operations in politically stable jurisdictions (Canada, Finland, Mexico) and a strong dividend record. Wheaton Precious Metals (WPM) is the premier royalty/streaming vehicle with the best margin profile in the sector. For leverage, mid-tier producers like Kinross (KGC) and B2Gold (BTG) offer higher beta with reasonable cost profiles.
Miners operate the mine — employing workers, buying equipment, managing all operational risk — and their margins depend on AISC relative to the gold price. Royalty and streaming companies (WPM, FNV, RGLD) provide upfront capital in exchange for a fixed percentage of metal production at a pre-agreed price. They carry no operating costs, no mine risk, and natural diversification across dozens of assets — which is why they trade at premium multiples.
Gold equities have operating leverage to the gold price: a 10% move in gold typically produces a 20-30% move in senior miner earnings, because most mining costs are fixed. This amplification makes gold stocks attractive in bull markets and risky in bear markets. Royalty companies have the same exposure with less downside volatility since they carry no operating costs. Use P/NAV at spot gold versus the historical range to judge whether miners are cheap or expensive relative to the current gold price.
Silver is both a precious metal and an industrial metal — roughly 55% of silver demand is industrial (solar panels, electronics, EV charging), which gives silver stocks additional sensitivity to manufacturing and energy transition themes beyond the gold-like store-of-value demand. Primary silver miners (PAAS, HL, AG) have higher price volatility than gold miners due to the wider silver price swings. Gold-silver royalty companies like WPM hold both metals and smooth out some of that volatility.