Solid oil prices, a stable integrated business model and robust midstream operations make the Zacks Oil and Gas Integrated International industry's outlook bright. XOM, CVX, BP and E will make the most of the favorable business scenario.
Chevron's Q2 2026 results demonstrate exceptional operational leverage, with gross margins expanding to 45.5% and EPS reaching $6.11, driven by record U.S. upstream production and refinery throughput. However, revenue contracted 4.6% year-over-year, and the dr...
Price trend, volume and key moving averages
Start with the evidence for owning the stock and the risks that can break the thesis.
Q2 2026 gross margin expanded to 45.5% from 29.7% a year earlier, driving EPS to $6.11 despite a 4.6% revenue decline, indicating margin-driven earnings growth rather than top-line expansion.
If oil prices remain above $90 per barrel, Chevron's earnings trajectory would significantly improve, with Goldman Sachs predicting $100 oil through the end of 2026.
Chevron is expected to achieve about 7-10% production growth in FY 2026, driven by key projects like the Guyana Stabroek block.
Chevron targets $3-4 billion in cost reductions by the end of 2026, enhancing its operational strength.
A significant drop in oil and gas prices would directly impact Chevron's profitability, as prices are subject to global dynamics.
Political instability in regions like the Middle East or Venezuela could disrupt Chevron's operations and production.
Potential operational disruptions and environmental issues could hinder Chevron's growth and project execution.
Trailing total returns as of 9/23/2026, which may include dividends or other distributions. Benchmark is S&P 500 (^GSPC).
Check whether operating performance supports the current valuation.
Recent results and news deserve attention only when they alter the forward view.
| Quarter | EPS (Act vs Est) | Revenue (Act vs Est) |
|---|---|---|
Q3 2026Latest Jul 31, 2026 | $6.06+9.2% vs $5.55 | $70.1B+11.7% vs $62.7B |
Q2 2026 May 1, 2026 | $1.41+41.0% vs $1.00 | $48.6B-6.3% vs $51.9B |
Q1 2026 Jan 30, 2026 | $1.52+7.8% vs $1.41 | $46.9B+0.2% vs $46.8B |
Q4 2025 Oct 31, 2025 | $1.85+9.5% vs $1.69 | $48.2B-1.6% vs $48.9B |
Solid oil prices, a stable integrated business model and robust midstream operations make the Zacks Oil and Gas Integrated International industry's outlook bright. XOM, CVX, BP and E will make the most of the favorable business scenario.
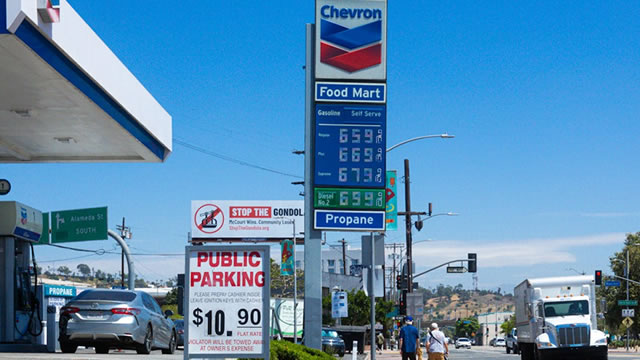
JPMorgan's commodity team admitted what many are thinking on the Iran situation and oil: We just don't know. The biggest energy stock getting some analyst love is Chevron.

Chevron (CVX) closed at $203.78 in the latest trading session, marking a -2.73% move from the prior day.

U.S. imports of Venezuelan crude jumped by 183,000 barrels per day in the week ended Sept. 11, reaching 782,000 barrels per day, according to the U.S. Energy Information Administration.

Benchmark CVX against direct peers instead of judging its metrics in isolation.
Key metrics vs top competitors for Chevron Corporation (CVX)
| Company | Price | Market Cap | P/E Ratio | Rev Growth (1Y) | Net Margin | ROE | Div Yield |
|---|---|---|---|---|---|---|---|
| $202.43 | $403.16B | 30.53 | -4.64% | 6.67% | 7.12% | 3.39% | |
| $158.69 | $657.76B | 23.69 | -4.52% | 9.07% | 12.34% | — | |
| $43.10 | $112.54B | 2112.75 | 0.08% | 2.51% | 7.19% | — | |
| $93.93 | $261.89B | 15.66 | -6.13% | 8.76% | 14.64% | — | |
| $89.85 | $200.1B | 15.55 | -6.78% | 9.07% | 14.5% | — | |
| $125.27 | $152.62B | 19.73 | 7.51% | 14.87% | 14.32% | — |
Chevron Corporation (CVX) vs competitors — business, growth, and fundamentals comparison against the closest industry rivals.
Verify the primary filings, follow material updates, and answer the remaining questions.
Chevron Corporation (CVX) SEC filings — annual & quarterly reports (10-K, 10-Q)
Jul 31, 2026·SEC
May 29, 2026·SEC
May 29, 2026·SEC
Get notified when CVX posts new earnings or crosses analyst targets
Free. No account needed. Unsubscribe any time.
Chevron Corporation (CVX) stock FAQ — growth, dividends, profitability & financials explained
Chevron Corporation (CVX) reported $208.71B in revenue for fiscal year 2025. This represents a 375% increase from $43.89B in 1996.
Chevron Corporation (CVX) saw revenue decline by 4.6% over the past year.
Yes, Chevron Corporation (CVX) is profitable, generating $20.59B in net income for fiscal year 2025 (6.7% net margin).
Yes, Chevron Corporation (CVX) pays a dividend with a yield of 3.39%. This makes it attractive for income-focused investors.
Chevron Corporation (CVX) has a return on equity (ROE) of 7.1%. This is below average, suggesting room for improvement.
Chevron Corporation (CVX) generated $26.63B in free cash flow for fiscal year 2025. Positive FCF indicates the company can fund dividends, buybacks, or reinvestment.