
Long-Legged Doji Candlestick Pattern: The Candle at Block's 2021 Top and SLB's 2025 Low
 Anish DasUpdated Nov 7, 202610 min read
Long-legged dojiLesson 23 of 44 · Doji and indecision
- Reads
- Neutral
- One candle
On October 26, 2021, Block, then still called Square, printed a long-legged doji at a prior high. Sold at that close with a stop above its high, the trade risked 2.6%. By January 21, 2022 the stock was down 55.2%, with no gap down along the way.
On October 17, 2025, the day it reported quarterly results, SLB printed one at its lowest price since April. Bought at that close with a stop under its low, the trade risked 3.0%. By March 27, 2026 the stock was up 64.0%.
Same candle, opposite moves. A long-legged doji says the day ran hard both ways and ended in a draw, and the next close says who won. Block has not traded above its doji's high since, and SLB has not traded below its doji's low. Here is how to read a long-legged doji, where the stop goes, and how to find the next one.
What the long-legged doji did#
A long-legged doji at a high is a sell signal for holders and an entry for short sellers. One at a low is a buy for the bounce.
$10,000 held through the fall$3,368
- Where
- A prior high
- The trade
- Sell or short at the close
- Entry
- 263.39
- Stop
- 270.16, the high (2.6% risk)
- Next session
- −3.9%
- Ten sessions later
- −12.4%
- Best close within 60 sessions
- −55.2% (Jan 21, 2022)
- Best close within 120 sessions
- −66.3% (Feb 23, 2022)
- Reward for each $1 risked
- $25.80 on a short
- Stop hit since?
- Never
$10,000 became$16,396
- Where
- A six-month low
- The trade
- Buy at the close
- Entry
- 32.63
- Stop
- 31.64, the low (3.0% risk)
- Next session
- +2.5%
- Ten sessions later
- +10.5%
- Best close within 60 sessions
- +43.9% (Jan 14, 2026)
- Best close within 120 sessions
- +64.0% (Mar 27, 2026)
- Reward for each $1 risked
- $21.08
- Stop hit since?
- Never
The $10,000 and reward rows use the 120-session numbers. Prices are split-adjusted, as on the chart.
The long-legged doji in one table#
A long-legged doji is one wide daily candle whose close lands almost exactly on its open. Price ran far above the open and far below it, and still ended where it began. It is a doji with a bigger fight inside it.
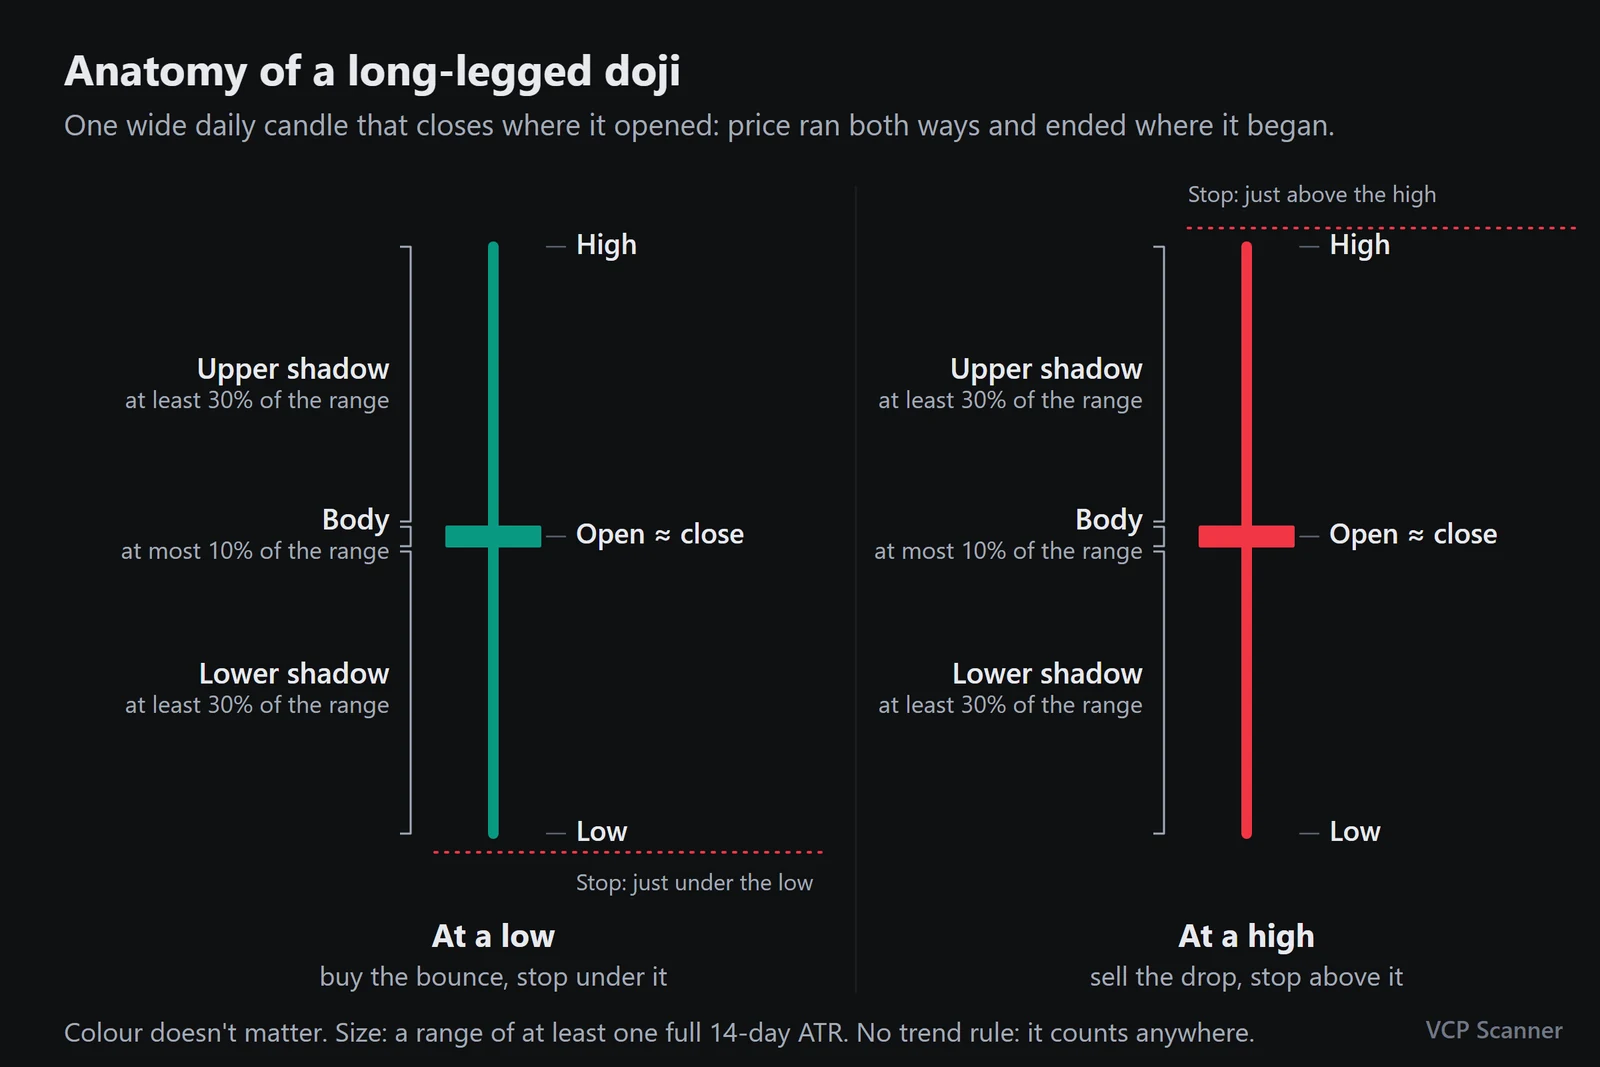
These are the rules the VCP Scanner terminal uses to name a long-legged doji on a daily chart.
| Part | Rule |
|---|---|
| Body | At most 10% of the day's range: the open and the close almost meet |
| Range | At least one full 14-day ATR, twice the minimum for a plain doji |
| Shadows | The upper and the lower shadow are each at least 30% of the range |
| Position | None: it counts after a decline, after a rally or in a range |
The colour does not matter. Block's closed 36 cents above its open and SLB's 7 cents below it.
Both shadows have to be long. When one shadow takes 70% of the range or more, the candle is a dragonfly doji at a low or a gravestone doji at a high instead, and those point one way.
Same shape, different place#
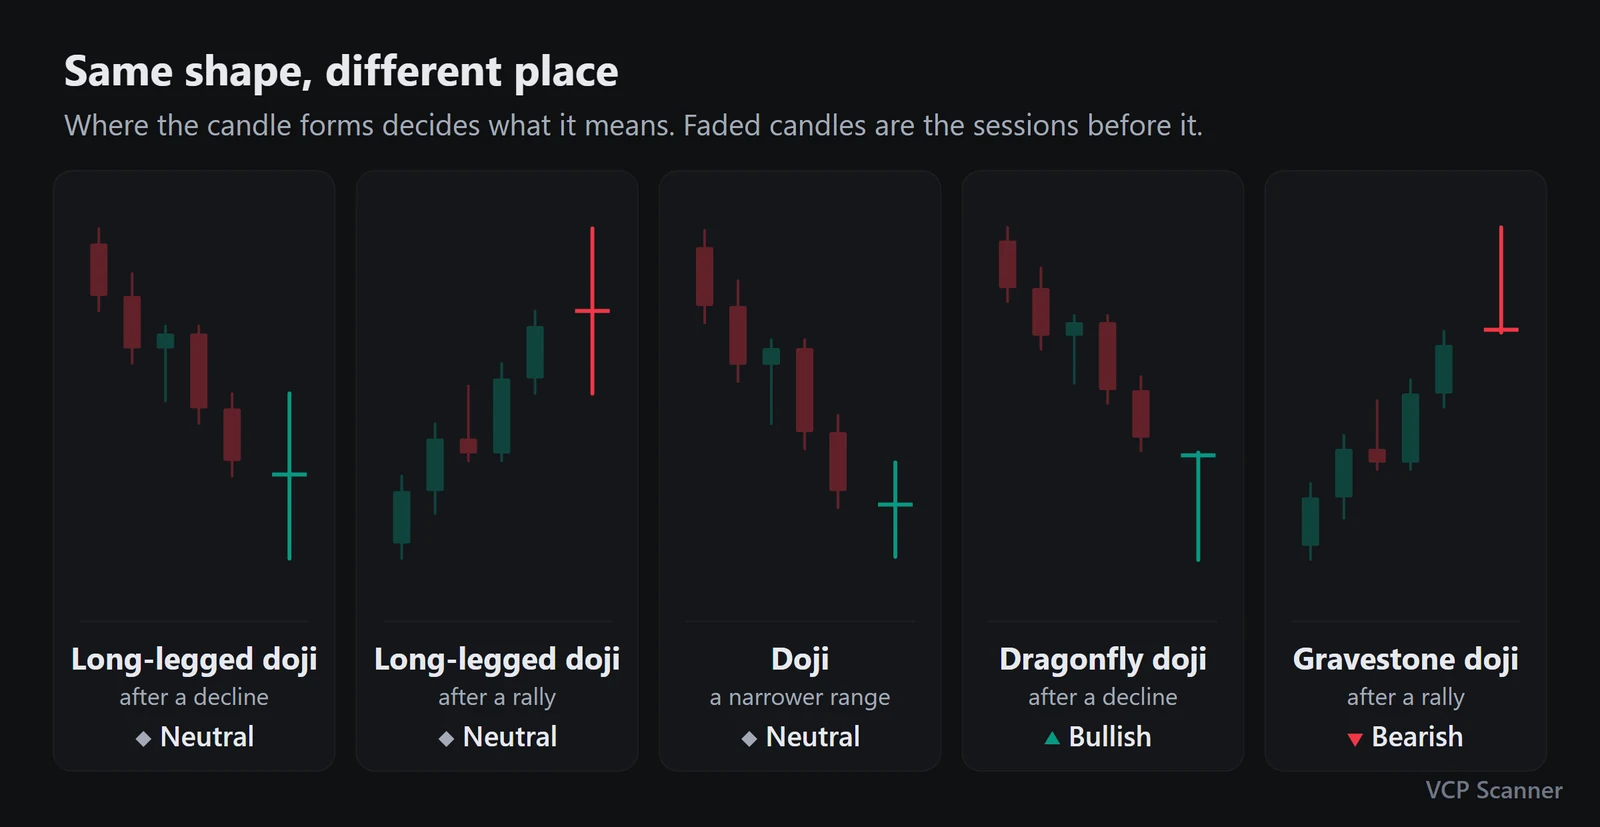
| Candle | Shape | Forms after | Reads as |
|---|---|---|---|
| Long-legged doji | A doji with long shadows, 1 ATR+ | Anywhere | Neutral |
| Doji | Open ≈ close, a narrower range | Anywhere | Neutral |
| Dragonfly doji | A doji at the top of its range | A 5-session low | Bullish |
| Gravestone doji | A doji at the bottom of its range | A 5-session high | Bearish |
| Spinning top | Small body, shadows both ways | Anywhere | Neutral |
A spinning top has a bigger body than a doji, up to 30% of its range. When a long-legged doji's body sits inside a long red body after a decline, the pair is a bullish harami cross, and the terminal names the two-day pattern first.
Example 1: Block (XYZ) at a prior high, Oct 26, 2021#
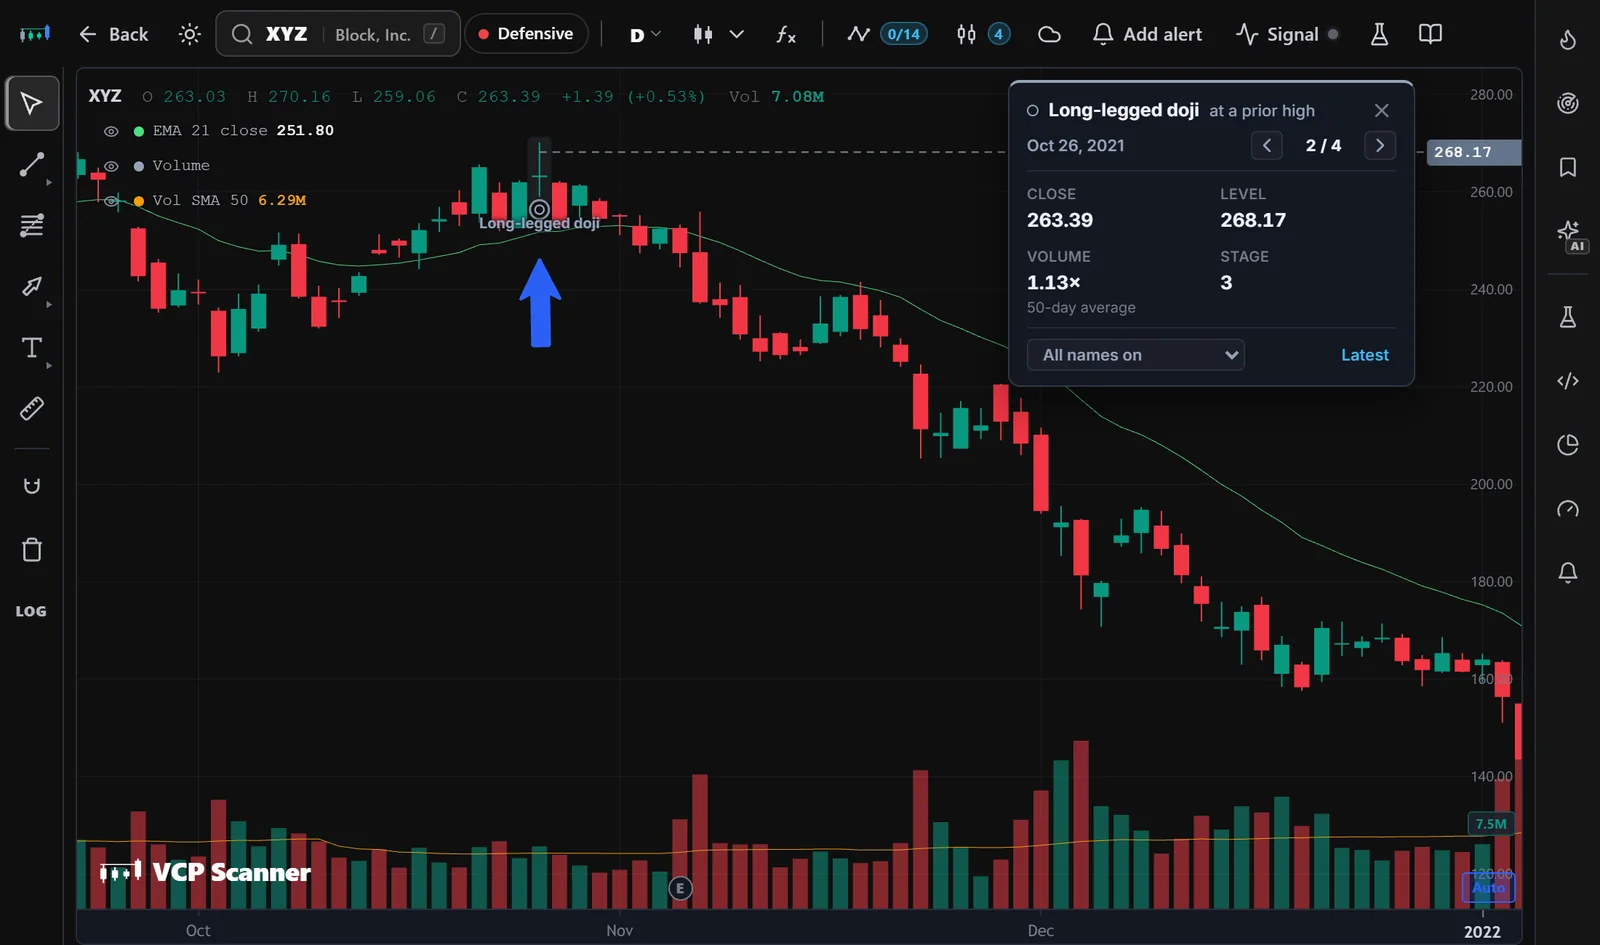
Open XYZ in the VCP Scanner terminal →
| Fact | XYZ, Oct 26, 2021 |
|---|---|
| Open / high / low / close | 263.03 / 270.16 / 259.06 / 263.39 |
| Body | 0.36, 3.2% of the 11.10 range |
| Shadows | Upper 6.77 (61% of the range), lower 3.97 (36%) |
| Level | A prior high: the Sep 23, 2021 high of 268.17, traded above and closed back below |
| High | The highest since Sep 7, 2021, 6.6% below the Aug 5, 2021 record of 289.23 |
| Stop | 270.16, the doji's high |
| Risk to stop | 2.6% |
| Volume | 1.13× the 50-day average |
| Stage | 3 |
Block traded as Square (SQ) then. It took the name Block on Dec 10, 2021, and its ticker became XYZ on Jan 21, 2025.
What followed:
- Next session (Oct 27): closed at 253.02, down 3.9% and below the doji's low of 259.06. Its high of 262.31 is the highest Block has traded since.
- Ten sessions later (Nov 9): 230.78, −12.4%.
- Jan 21, 2022: 118.10, −55.2%, its lowest close since Jul 2, 2020. That is 21.5 times the 6.77 risked on each share.
- Feb 23, 2022: 88.72, −66.3%, its lowest close since Jun 12, 2020.
- The high of 270.16 was never taken out. On Nov 3, 2026 Block closed at 76.00, 71.1% below the doji's close.
The fall to Jan 21 came without a single gap down of 5% or more. The two in early February 2022 were under a tenth of the fall to Feb 23.
With $500 at risk, the stop sized a short at 73 shares, about $19,227. At the Feb 23, 2022 close the short was up $12,751.
Example 2: SLB at its October 2025 low, Oct 17, 2025#
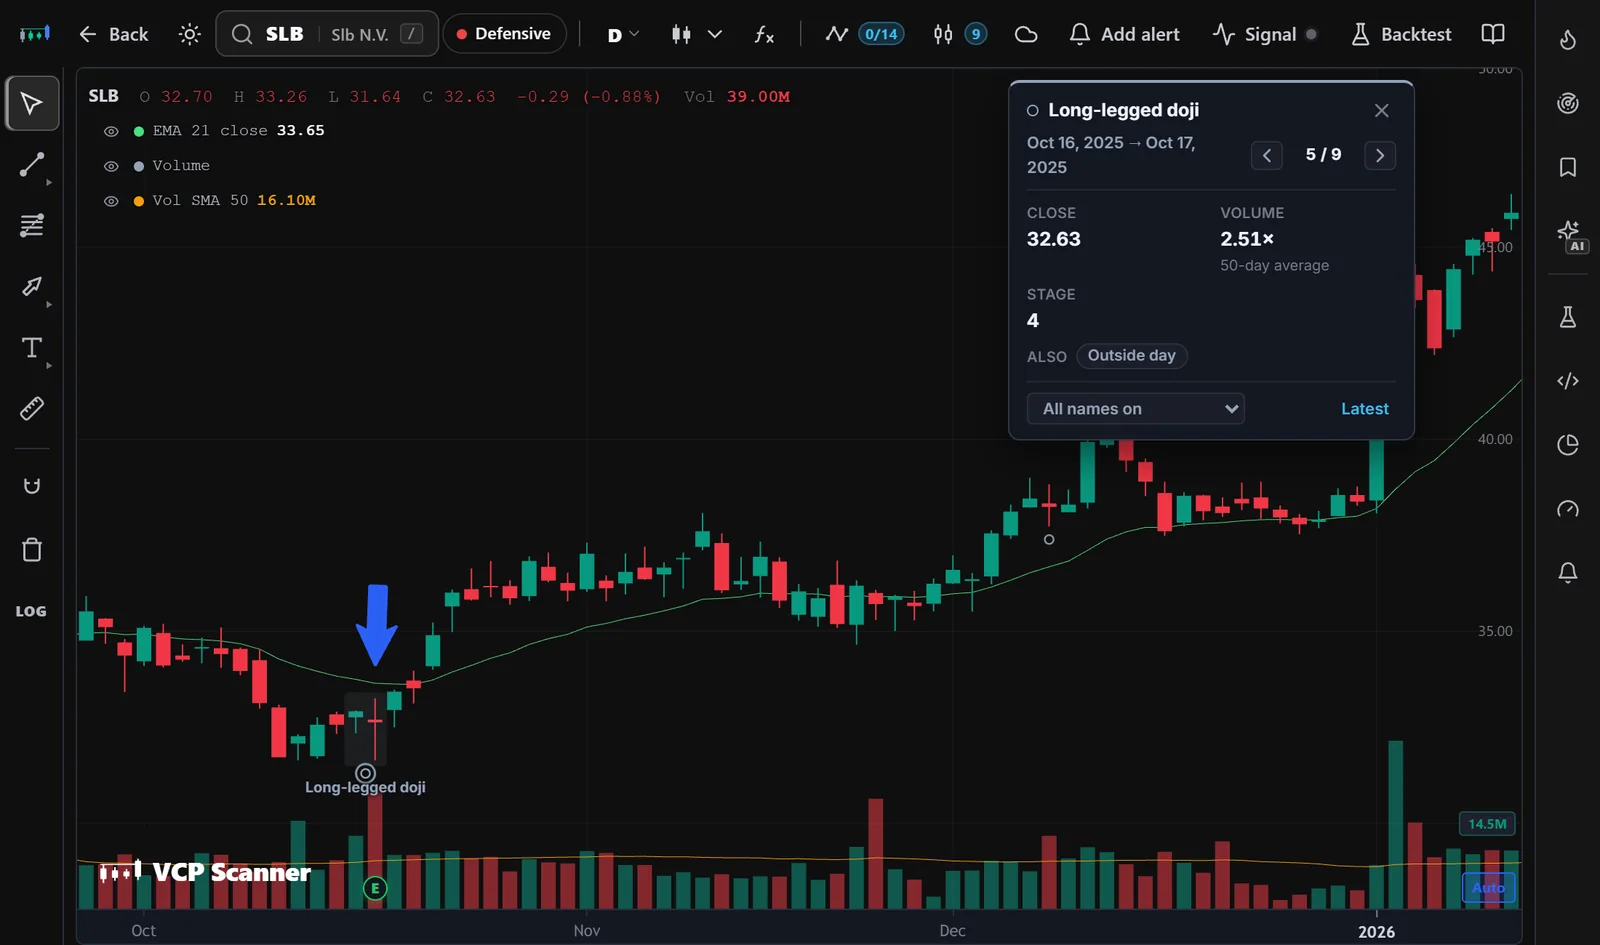
Open SLB in the VCP Scanner terminal →
| Fact | SLB, Oct 17, 2025 |
|---|---|
| Open / high / low / close | 32.70 / 33.26 / 31.64 / 32.63 |
| Body | 0.07, 4.3% of the 1.62 range |
| Shadows | Upper 0.56 (35% of the range), lower 0.99 (61%) |
| Low | 31.64, the Oct 13 low to the cent; the lowest since Apr 9, 2025, 29.6% below the Nov 12, 2024 high of 44.97; no key level |
| Day | SLB's third-quarter results |
| Stop | 31.64, the doji's low |
| Risk to stop | 3.0% |
| Volume | 2.51× the 50-day average |
| Stage | 4 |
| Also | Outside day |
SLB is the oilfield-services company once called Schlumberger.
What followed:
- Next session (Oct 20): closed at 33.43, up 2.5% and above the doji's high of 33.26. Its low of 32.50 is the lowest SLB has traded since.
- Ten sessions later (Oct 31): 36.06, +10.5%.
- Jan 14, 2026: 46.97, +43.9%, its highest close since Jul 31, 2024.
- Mar 27, 2026: 53.50, +64.0%, its highest close since Apr 11, 2024. That is 21.1 times the 0.99 risked on each share.
- The low of 31.64 was never broken. On Nov 3, 2026 SLB closed at 52.13, 59.8% above the doji's close.
One gap did about an eighth of the run to Mar 27: SLB opened 7.0% higher on Jan 5, 2026, after weekend news from Venezuela lifted oilfield-service stocks.
With $500 at risk, the stop sized the trade at 505 shares, about $16,478. At the Mar 27, 2026 close those shares were up $10,539.
Where a long-legged doji counts: key levels#
A long-legged doji on a level is a test of that level, from either side. In the terminal, the Only at a key level switch is on by default. For a long-legged doji it keeps the ones at any of these:
| Level | What it is |
|---|---|
| A prior low | A swing low that price undercuts and then closes back above |
| The 50-day or the 21-day EMA | A rising average in Stage 2, met from above |
| The pivot | A breakout's pivot price, retested from above |
| A prior high | A swing high at least 10 sessions old that price trades above, then closes back below |
| A failed breakout's pivot | The pivot of a breakout that failed, met again from below |
| The 50-day or the 21-day EMA from below | A falling average in Stage 3 or 4, met from below |
Block's was a prior-high doji: it traded above the Sep 23 high and closed back below it, so it shows with the default switch. SLB's matched its Oct 13 low without undercutting it, so it sits on none of these levels. To see ones like it, turn Only at a key level off.
Block was in Stage 3, Stan Weinstein's topping stage: after an advance, the 30-week average flattens and the stock trades around it. SLB was in Stage 4, the declining stage, and its doji marked the end of the decline.
How to trade a long-legged doji#
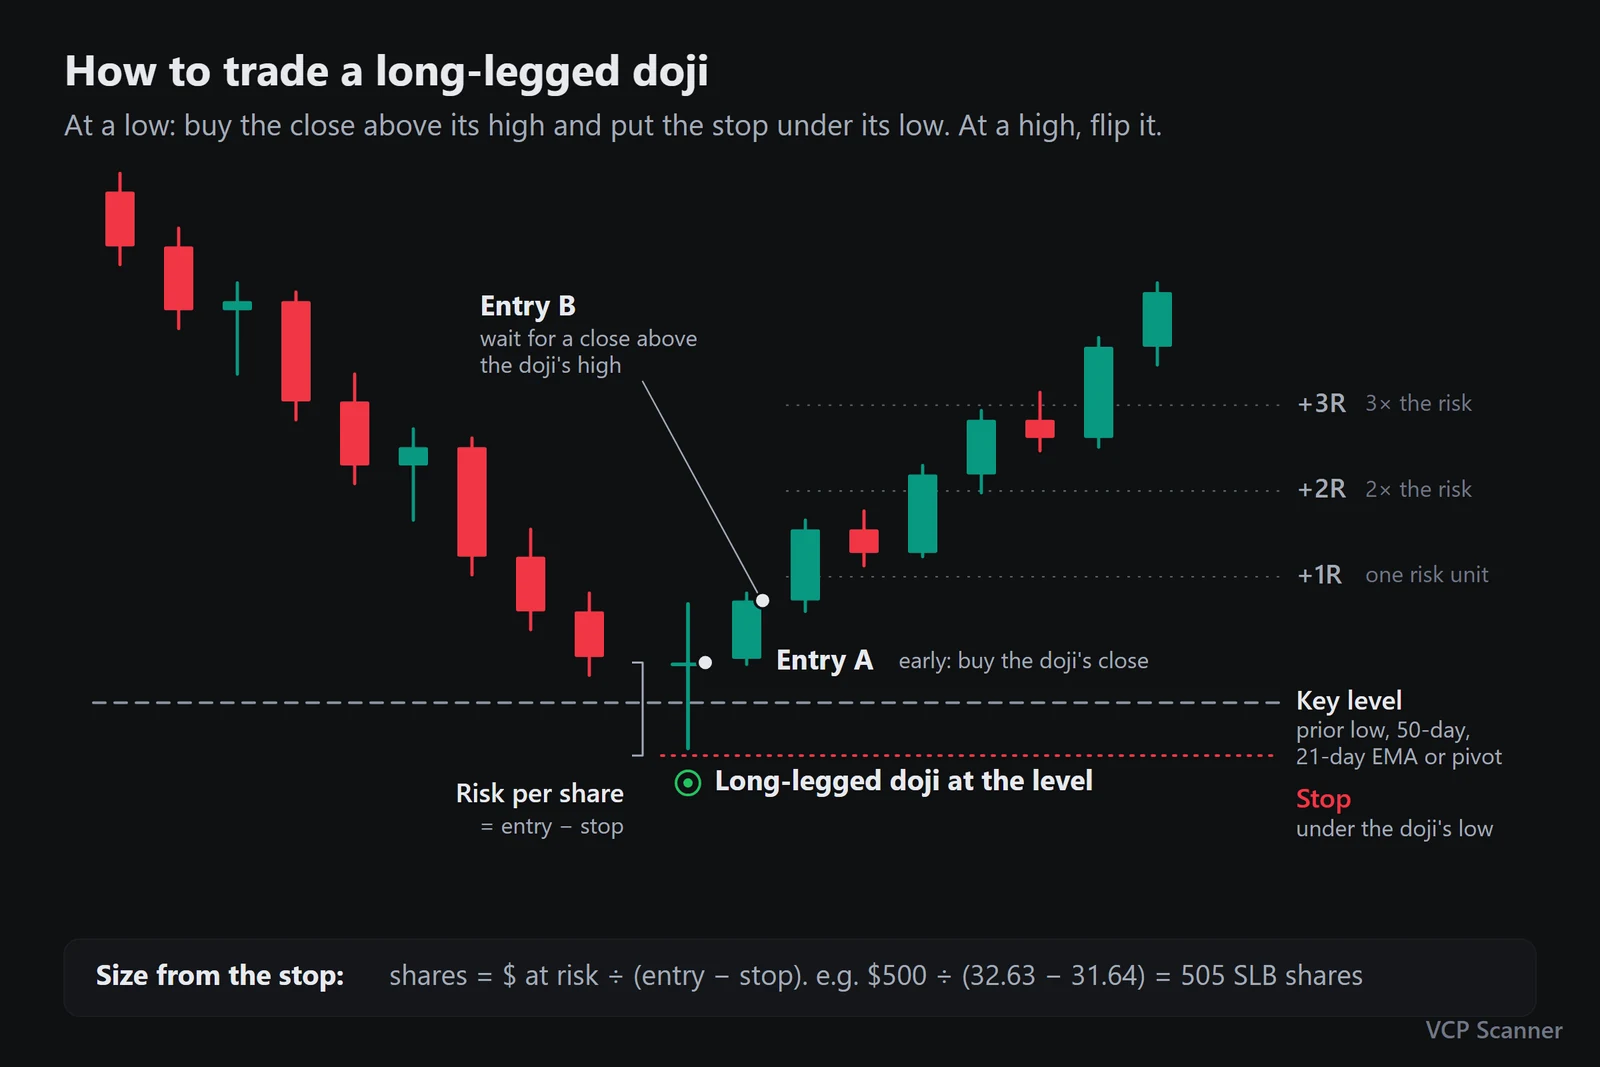
- Find the place. A long-legged doji means little in the middle of a range. Look for it at a prior high or a fresh multi-month high after a rally, or at a prior low or a multi-month low after a decline, like Block's in October 2021 and SLB's in October 2025.
- Check the shape. A tiny body and long shadows both ways, on a range of at least a full ATR. Block's body was 3.2% of its range and SLB's 4.3%.
- Wait for the next close. At a high, sell the first close below the doji's low. At a low, buy the first close above its high. Block and SLB both gave that close the very next session. Some traders take the doji's own close instead, an entry closer to the stop, as in the table above.
- Put the stop on the other side. Above the doji's high when you sell, under its low when you buy. The terminal draws no stop for a long-legged doji, so set it yourself from the doji's high or low. Its wide range makes the stop wider than a plain doji's.
- Size from the stop. Shares = money at risk ÷ (entry − stop). With $500 at risk on SLB: 500 ÷ (32.63 − 31.64) = 505 shares.
Find long-legged dojis on any chart in VCP Scanner#
- Open a stock in the terminal, for example XYZ or SLB.
- Open Candles in the chart toolbar and tick Long-legged doji under Neutral.
- Only at a key level is on by default. Turn it off to see every long-legged doji on the chart.
- The chart jumps to the latest long-legged doji. A dot marks each one under its low.
- The inspector lists the close, level, volume and stage. When the long-legged doji is the bar's only name it shows no stop, because it points neither way. Walk through the others with the ← and → keys.
- Mark the ones you care about with the drawing tools. The arrows in the charts above are the Arrow Marker (Alt+A): click where the arrow starts, then click the candle.
Candles are free, on daily, weekly and monthly charts.
Bottom line#
- A long-legged doji is a wide day that ends where it began: price ran far both ways, and neither side won.
- Block's marked its October 2021 top and SLB's its October 2025 low. They risked 2.6% and 3.0%. Block fell 55.2% within 60 sessions, and SLB rose 64.0% within 120.
- The next close decides the direction, and the doji's other end is the stop. It defines your risk before you take the trade.
Data: VCPScanner daily market data through Nov 3, 2026, split-adjusted. The examples are for education, not recommendations.
Quick answers
Is a long-legged doji bullish or bearish?
Neither on its own. Price ran far both ways and ended where it began, so the next close decides. Block's at its October 2021 top was followed by a close below its low, SLB's at its October 2025 low by a close above its high.
What is the difference between a long-legged doji and a doji?
The width. A doji needs a range of half the 14-day ATR. A long-legged doji needs a full ATR or more, with each shadow at least 30% of the range.
Does the colour of a long-legged doji matter?
No. Block's closed 36 cents above its open and SLB's 7 cents below it. Both count the same.
Where does the stop go on a long-legged doji?
On the far side of the move you trade. Under the low when you buy one at a low, above the high when you sell one at a high. The terminal draws no stop for it, because a long-legged doji alone points neither way.
Does a long-legged doji need confirmation?
Yes, more than most candles. Wait for a close past its high at a low, or past its low at a high. Block and SLB both gave that close the very next session.
All 44 candles on one cheat sheet.
Enter your email and download it right away. You also get our weekly market brief, every Friday.