
Three White Soldiers Candlestick Pattern: The Three Days Before Vistra's 186% Run and Alphabet's Record Climb
 Anish DasUpdated Nov 8, 20269 min read
Three white soldiersLesson 18 of 44 · Three candlesOpposite: Three black crows
- Reads
- Bullish
- Three candles
On December 4, 2023, Vistra closed at a record on its third long green day in a row: three white soldiers. Bought at that close with a stop under the first day's low, the trade risked 6.0%. By May 28, 2024 Vistra was up 186.1%, at another record close, without a single gap of 5% or more along the way.
On September 5, 2025, Alphabet finished the same three-day shape at a record close, starting the morning after a judge let Google keep Chrome. That trade risked 4.3%. By February 2, 2026 Alphabet was up 46.3%, at another record.
Three white soldiers are three days in which buyers won from the open to the close. Neither stock has traded under its pattern's low since. Here is how to read them, where the stop goes, and how to find the next set.
What the three white soldiers did#
$10,000 became$28,610
- Bought at day 3's close
- 37.12
- Stop
- 34.89, day 1's low (6.0% risk)
- Next session
- +0.7%
- Ten sessions later
- +1.7%
- Best close within 60 sessions
- +46.9% (Feb 29, 2024)
- Best close within 120 sessions
- +186.1% (May 28, 2024)
- Reward for each $1 risked
- $30.98
- Stop hit since?
- Never
$10,000 became$14,625
- Bought at day 3's close
- 235.00
- Stop
- 224.79, day 1's low (4.3% risk)
- Next session
- −0.4%
- Ten sessions later
- +8.4%
- Best close within 60 sessions
- +37.6% (Nov 25, 2025)
- Best close within 120 sessions
- +46.3% (Feb 2, 2026)
- Reward for each $1 risked
- $10.65
- Stop hit since?
- Never
The $10,000 and reward rows use the 120-session numbers. Prices are split-adjusted, as on the chart.
Three white soldiers in one table#
Three white soldiers are three long green days in a row. Each opens inside the body of the day before, rises all session and closes near its high. Each close is higher than the last.
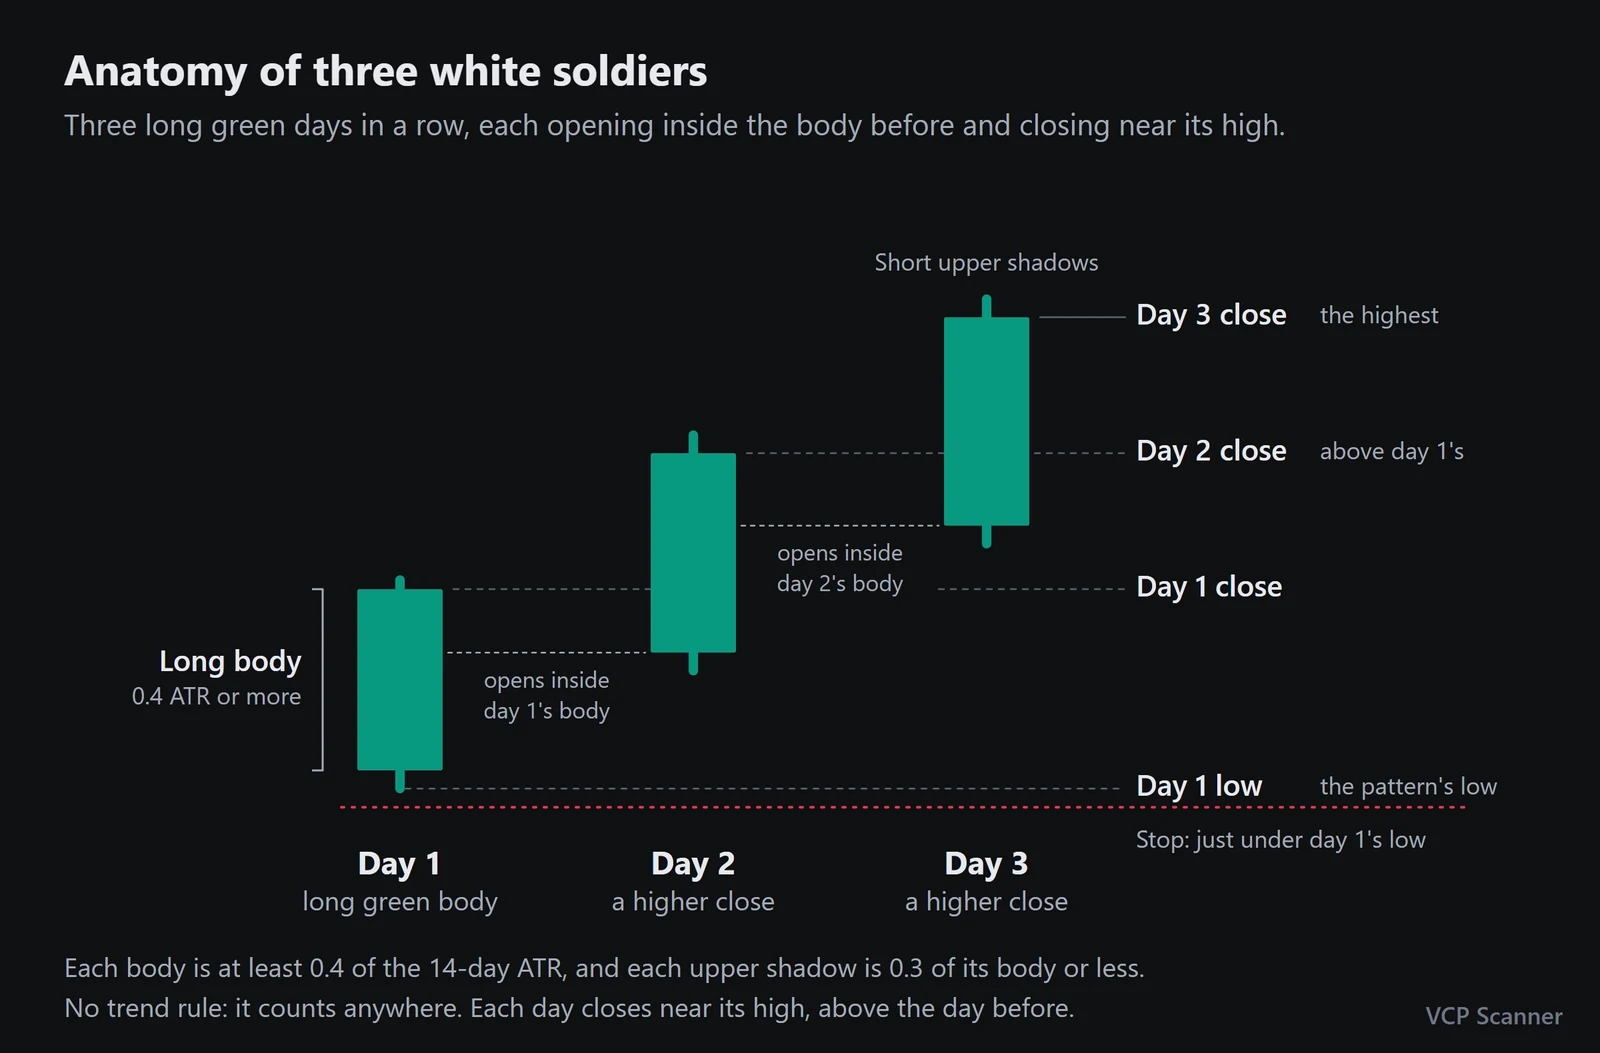
These are the rules the VCP Scanner terminal uses to name three white soldiers on a daily chart.
| Part | Rule |
|---|---|
| Each day | Green, with a body at least 0.4 of the 14-day ATR |
| Upper shadow | 0.3 of the body or less: each day closes near its high |
| The opens | Days 2 and 3 open inside the previous day's body |
| The closes | Each close above the day before |
| Position | None: it counts after a decline, in a base or in an uptrend |
| Stop | Just under the pattern's low, day 1's low, drawn by the terminal |
Day 1 can open with a gap. Alphabet's did: it opened 7.0% above the prior close on the ruling.
Three white soldiers and their look-alikes#
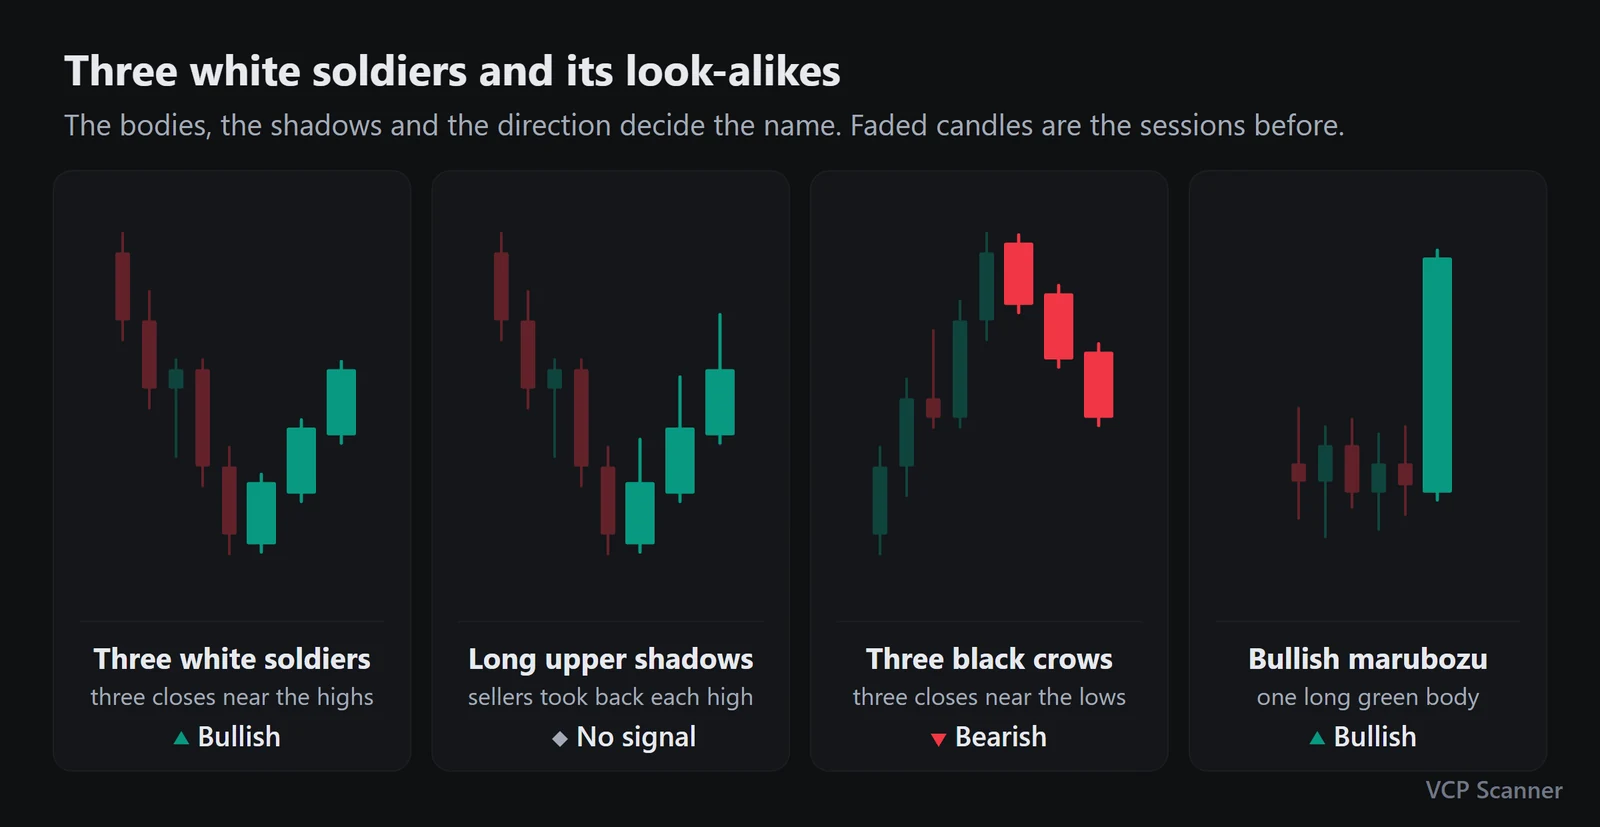
| Pattern | What it needs | Reads as |
|---|---|---|
| Three white soldiers | Three long green days, each closing near its high and higher | Bullish |
| Long upper shadows | Three green days that give back most of each high | No signal |
| Three black crows | Three long red days, each closing near its low and lower | Bearish |
| Bullish marubozu | One long green body with almost no shadows | Bullish |
Three green days with long upper shadows fail the shadow rule: sellers took back each day's high. A day 3 with almost no shadows is also a bullish marubozu, and the terminal lists it under Also: Vistra's was. For a pause inside a move up, see the rising three methods.
Example 1: Vistra (VST) before its 2024 run, Nov 30 to Dec 4, 2023#
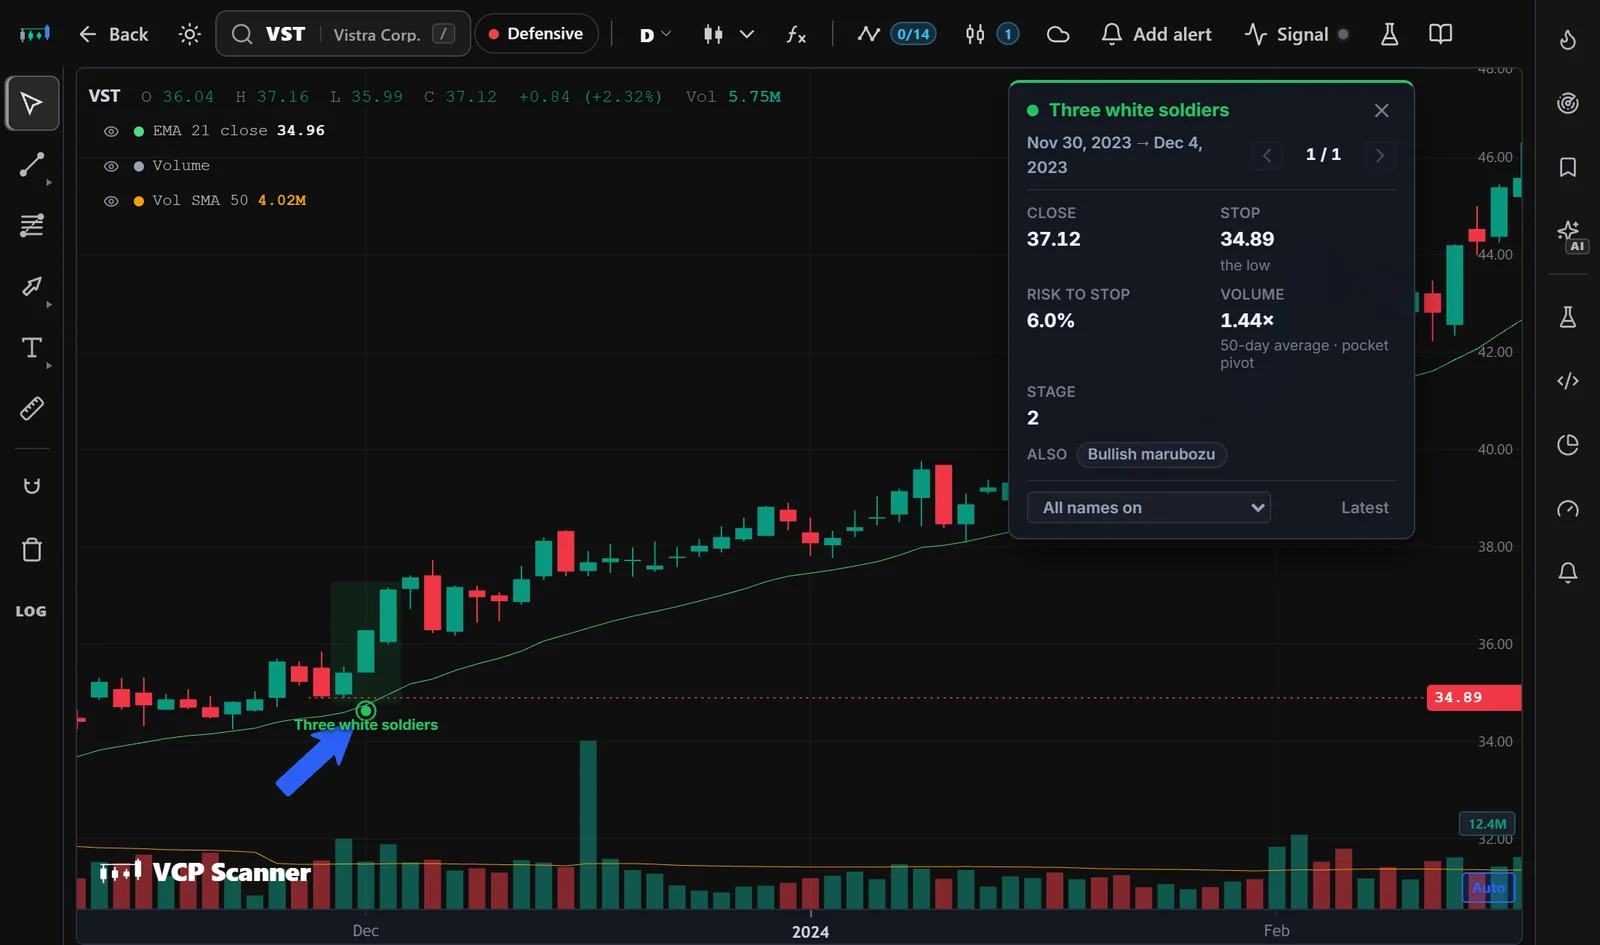
Open VST in the VCP Scanner terminal →
| Fact | VST, Nov 30 to Dec 4, 2023 |
|---|---|
| Day 1, Nov 30: open / high / low / close | 34.96 / 35.53 / 34.89 / 35.41 |
| Day 2, Dec 1 | 35.41 / 36.28 / 35.41 / 36.28 |
| Day 3, Dec 4 | 36.04 / 37.16 / 35.99 / 37.12, a record close |
| The three days | +6.3% from the Nov 29 close of 34.92 |
| Place | At a record high; no key level |
| Stop | 34.89, day 1's low |
| Risk to stop | 6.0% |
| Volume on day 3 | 1.44× the 50-day average |
| Stage | 2 |
| Also | Bullish marubozu |
Vistra owns power plants, and in 2024 it became one of the market's favourite plays on the electricity that AI data centers need. It finished 2024 as the S&P 500's second-best stock, behind only Palantir. These three days came at the start of that run.
What followed:
- Next session (Dec 5): closed at 37.37, up 0.7%, its first close above the pattern's high of 37.16.
- Ten sessions later (Dec 18): 37.76, +1.7%.
- Feb 29, 2024: 54.54, +46.9%, a record close.
- May 28, 2024: 106.20, +186.1%, another record close. That is 31.0 times the 2.23 risked on each share.
- The stop was never hit. The lowest Vistra has traded since is 36.17. On Nov 6, 2026 it closed at 124.80, 236.2% above day 3's close.
The whole run to May 28 came without a gap of 5% or more: Vistra nearly tripled one session at a time.
With $500 at risk, the stop sized the trade at 224 shares, about $8,315. At the May 28, 2024 close those shares were up $15,474.
Example 2: Alphabet (GOOGL) after the Chrome ruling, Sep 3 to 5, 2025#
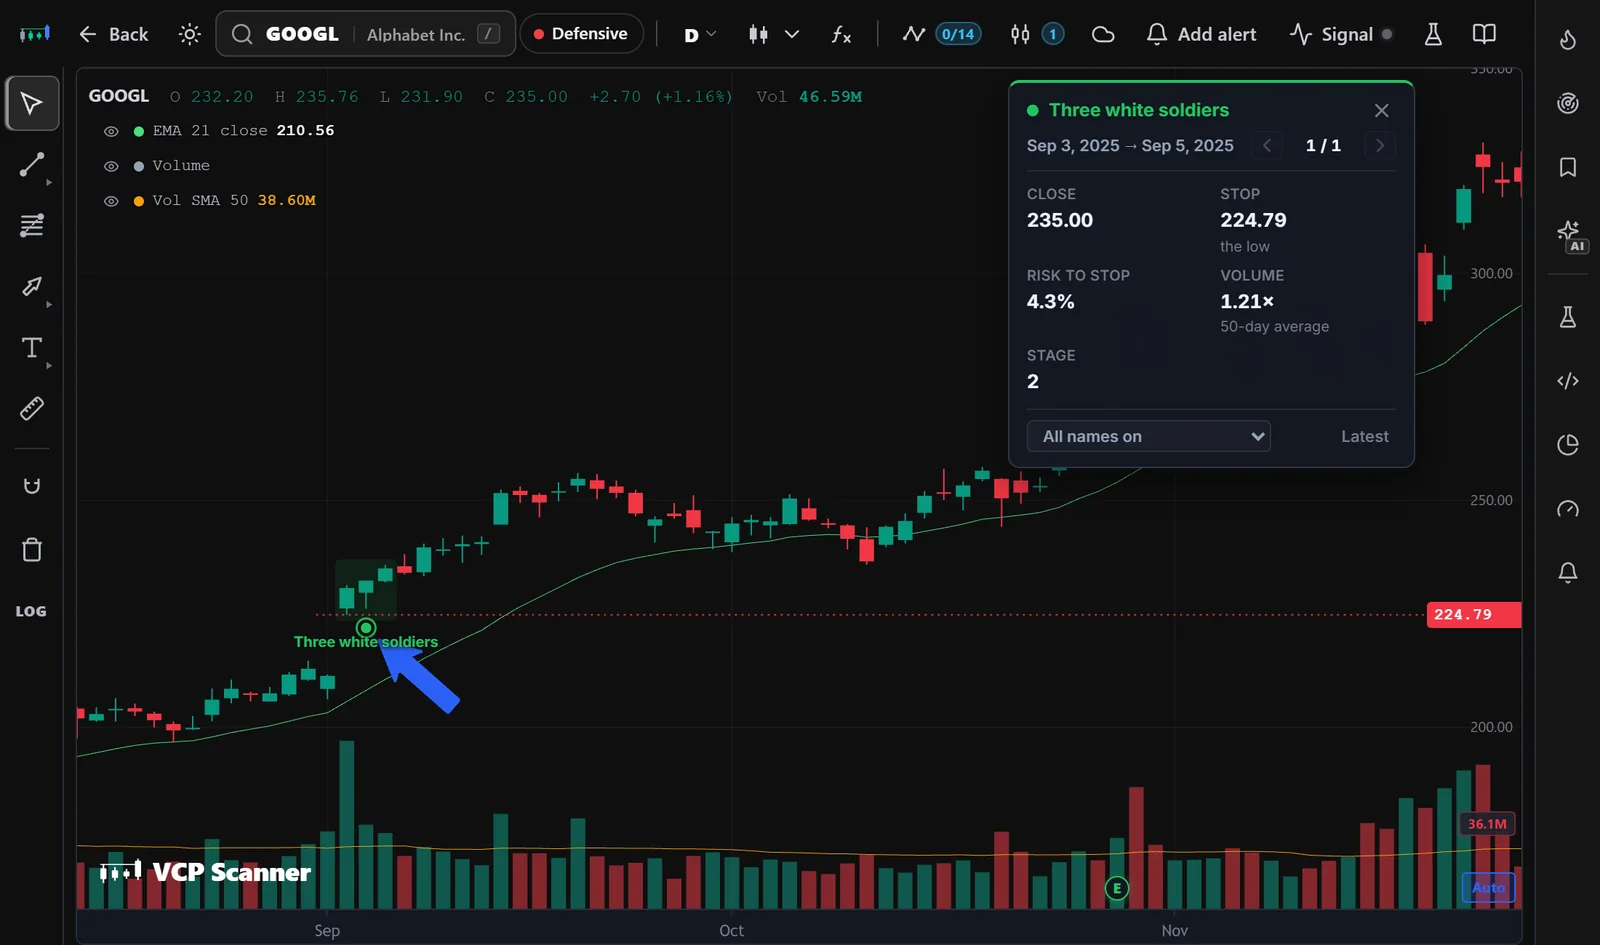
Open GOOGL in the VCP Scanner terminal →
| Fact | GOOGL, Sep 3 to 5, 2025 |
|---|---|
| Day 1, Sep 3: open / high / low / close | 226.21 / 231.31 / 224.79 / 230.66, up 9.1% |
| Day 2, Sep 4 | 229.65 / 232.37 / 226.11 / 232.30 |
| Day 3, Sep 5 | 232.20 / 235.76 / 231.90 / 235.00, a record close |
| The three days | +11.2% from the Sep 2 close of 211.35 |
| Place | At a record high; no key level |
| Stop | 224.79, day 1's low |
| Risk to stop | 4.3% |
| Volume on day 1 | 2.77× the 50-day average |
| Stage | 2 |
The evening before day 1, a federal judge ruled in the government's search case that Google would not have to sell its Chrome browser. Investors had feared a breakup. Alphabet rose 9.1% that day on 2.77 times its average volume, then added two more green days. All three closed at records.
What followed:
- Next session (Sep 8): closed at 234.04, down 0.4%.
- First close above the pattern's high (Sep 9): 239.63, two sessions later.
- Ten sessions later (Sep 19): 254.72, +8.4%, a record close.
- Nov 25, 2025: 323.44, +37.6%, a record close.
- Feb 2, 2026: 343.69, +46.3%, another record close. That is 10.6 times the 10.21 risked on each share.
- The stop was never hit. The lowest Alphabet has traded since is 233.23. On Nov 6, 2026 it closed at 284.78, 21.2% above day 3's close.
One 5% gap up did about a fifth of the climb to November 25: Oct 30, the morning after Alphabet's third-quarter report.
With $500 at risk, the stop sized the trade at 48 shares, about $11,280. At the Feb 2, 2026 close those shares were up $5,217.
Where three white soldiers count: key levels#
Three white soldiers rising off a level show buyers taking control at support. In the terminal, the Only at a key level switch is on by default and keeps the patterns at one of these:
| Level | What it is |
|---|---|
| The 50-day | The 50-day moving average, rising, with the stock in Stage 2 |
| The 21-day EMA | The 21-day exponential average, rising and above the 50-day, in Stage 2 |
| A prior low | A swing low that price undercuts and then closes back above |
| The pivot | A breakout's pivot price, retested from above |
Neither example sat on one of these levels: both closed at record highs. To see patterns like them, turn Only at a key level off.
Both stocks were in Stage 2, Stan Weinstein's advancing stage, where the stock trades above a rising 30-week average. Three strong days at a record, in Stage 2, is buyers pressing an uptrend.
How to trade three white soldiers#
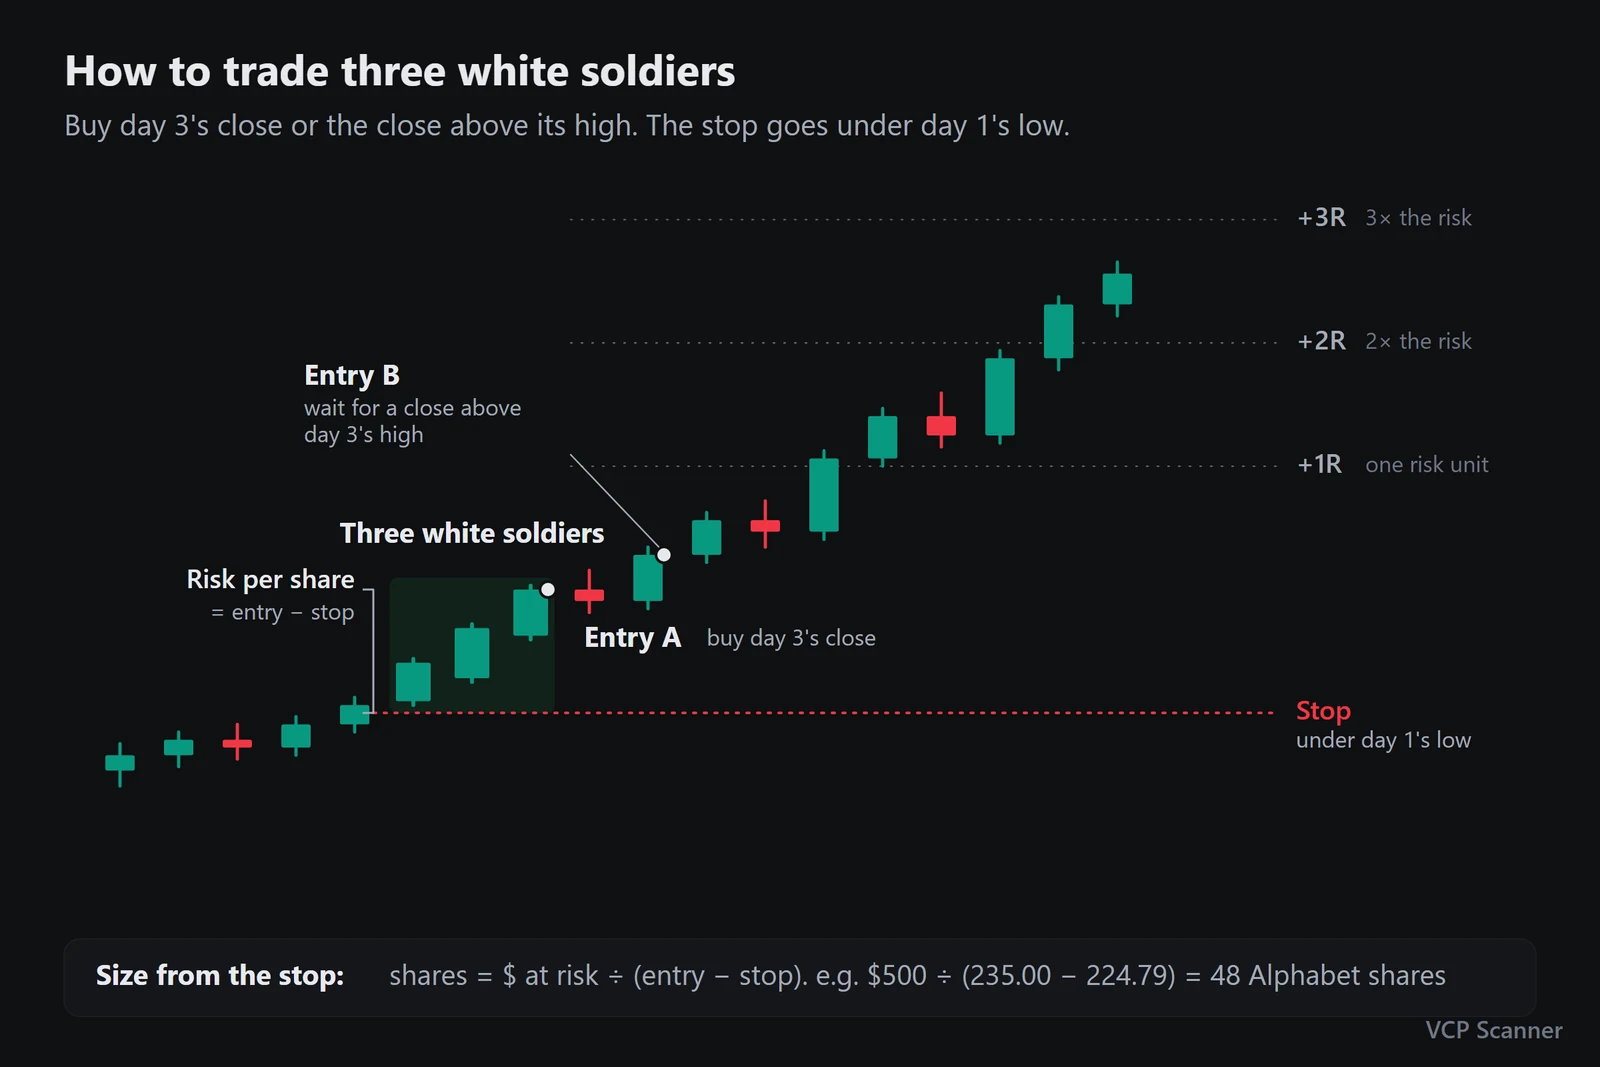
- Count three green days. Each with a long body, a short upper shadow and a higher close.
- Check the opens. Days 2 and 3 open inside the body of the day before, not with a gap.
- Choose your entry. Some traders buy day 3's close. Others wait for a close above its high. Vistra gave that close the next session, Alphabet two sessions later.
- Put the stop under day 1's low. The terminal draws it there. Three days of gains make the stop wider than a one-day candle's.
- Size from the stop. Shares = money at risk ÷ (entry − stop). With $500 at risk on Alphabet: 500 ÷ (235.00 − 224.79) = 48 shares.
Expect a slow start sometimes: ten sessions after its soldiers, Vistra was up only 1.7%.
Find three white soldiers on any chart in VCP Scanner#
- Open a stock in the terminal, for example VST or GOOGL.
- Open Candles in the chart toolbar and tick Three white soldiers.
- Only at a key level is on by default. Turn it off to see every set on the chart.
- The chart jumps to the latest one and shades its three days. A dot marks it under its low, and the selected one shows its stop on the price scale.
- The inspector lists the close, stop, risk to stop, level, volume and stage, and other names under Also. Walk through the others with the ← and → keys.
- Mark the ones you care about with the drawing tools. The arrows in the charts above are the Arrow Marker (Alt+A): click where the arrow starts, then click the candle.
Candles are free, on daily, weekly and monthly charts.
Bottom line#
- Three white soldiers are three long green days in a row, each closing near its high and above the day before.
- Vistra's at the start of its 2024 run and Alphabet's after the Chrome ruling risked 6.0% and 4.3%. Vistra rose 186.1% within 120 sessions, Alphabet 46.3%.
- Day 1's low is the stop. It defines your risk before you take the trade.
Data: VCPScanner daily market data through Nov 6, 2026, split-adjusted. The examples are for education, not recommendations.
Quick answers
What are three white soldiers?
Three long green daily candles in a row. Each closes near its high and above the day before, and days 2 and 3 open inside the previous day's body. Buyers won all three sessions.
Do three white soldiers need a downtrend first?
No. The VCP Scanner terminal has no trend rule for them. Vistra's came in Stage 2 and ended at a record close. Alphabet's came the week of the Chrome ruling, and all three days closed at records.
Where does the stop go on three white soldiers?
Just under the pattern's low, which is day 1's low. The terminal draws it there. Vistra's stop was 6.0% under day 3's close, Alphabet's 4.3%.
Are three white soldiers common?
Fairly. On 132 large US stocks the terminal found them 87 times from 2015 to November 2026, far more often than the rising three methods.
What is the bearish version?
Three black crows. Three long red days in a row, each closing near its low and below the day before, with days 2 and 3 opening inside the previous day's body.
All 44 candles on one cheat sheet.
Enter your email and download it right away. You also get our weekly market brief, every Friday.