
Shooting Star Candlestick Pattern: The Candle at Nvidia's 2018 Record High and Marvell's June 2026 Top
 Anish DasUpdated Nov 4, 20269 min read
Shooting starLesson 5 of 44 · Single candlesOpposite: Inverted hammer
- Reads
- Bearish
- One candle
On October 2, 2018, at Nvidia's record high, the stock printed a shooting star. Sold at that close with a stop above its high, the trade risked 2.2%. By December 24 the stock was down 55.6%.
On June 18, 2026, Marvell printed one at a prior high, on 6.25 times its average volume. The risk was 6.2%. By July 29 the stock was down 47.4%.
Marvell has never traded above its shooting star's high since. Nvidia stayed under its own for 344 sessions, until February 2020. Here is how to read a shooting star, where the stop goes, and how to find the next one.
What the fall cost#
A shooting star is a sell signal for holders and an entry for short sellers. Held through the fall, $10,000 of either stock lost about half its value.
$10,000 held through the fall$4,441
- Sold at the shooting star's close
- 7.16
- Stop: the shooting star's high
- 7.32 (2.2% risk)
- Next session
- +0.1%
- Ten sessions later
- −14.1%
- Twenty sessions later
- −29.1%
- Lowest close within 60 sessions
- −55.6% (Dec 24, 2018)
- Reward for each $1 risked on a short
- $24.87
- High taken out since?
- After 344 sessions (Feb 14, 2020)
$10,000 held through the fall$5,261
- Sold at the shooting star's close
- 310.58
- Stop: the shooting star's high
- 329.88 (6.2% risk)
- Next session
- −0.9%
- Ten sessions later
- −19.7%
- Twenty sessions later
- −37.2%
- Lowest close within 60 sessions
- −47.4% (Jul 29, 2026)
- Reward for each $1 risked on a short
- $7.63
- High taken out since?
- Never
Prices are split-adjusted, as on the chart. Nvidia has split 40 for 1 since 2018 (4 for 1 in 2021, 10 for 1 in 2024).
The shooting star in one table#
A shooting star is one daily candle with a long upper shadow, a small body near the bottom of the day's range and almost no lower shadow. Buyers pushed the stock well above the open, sellers took it back, and the close landed near the low. It is the hammer turned upside down, at a top instead of a bottom.
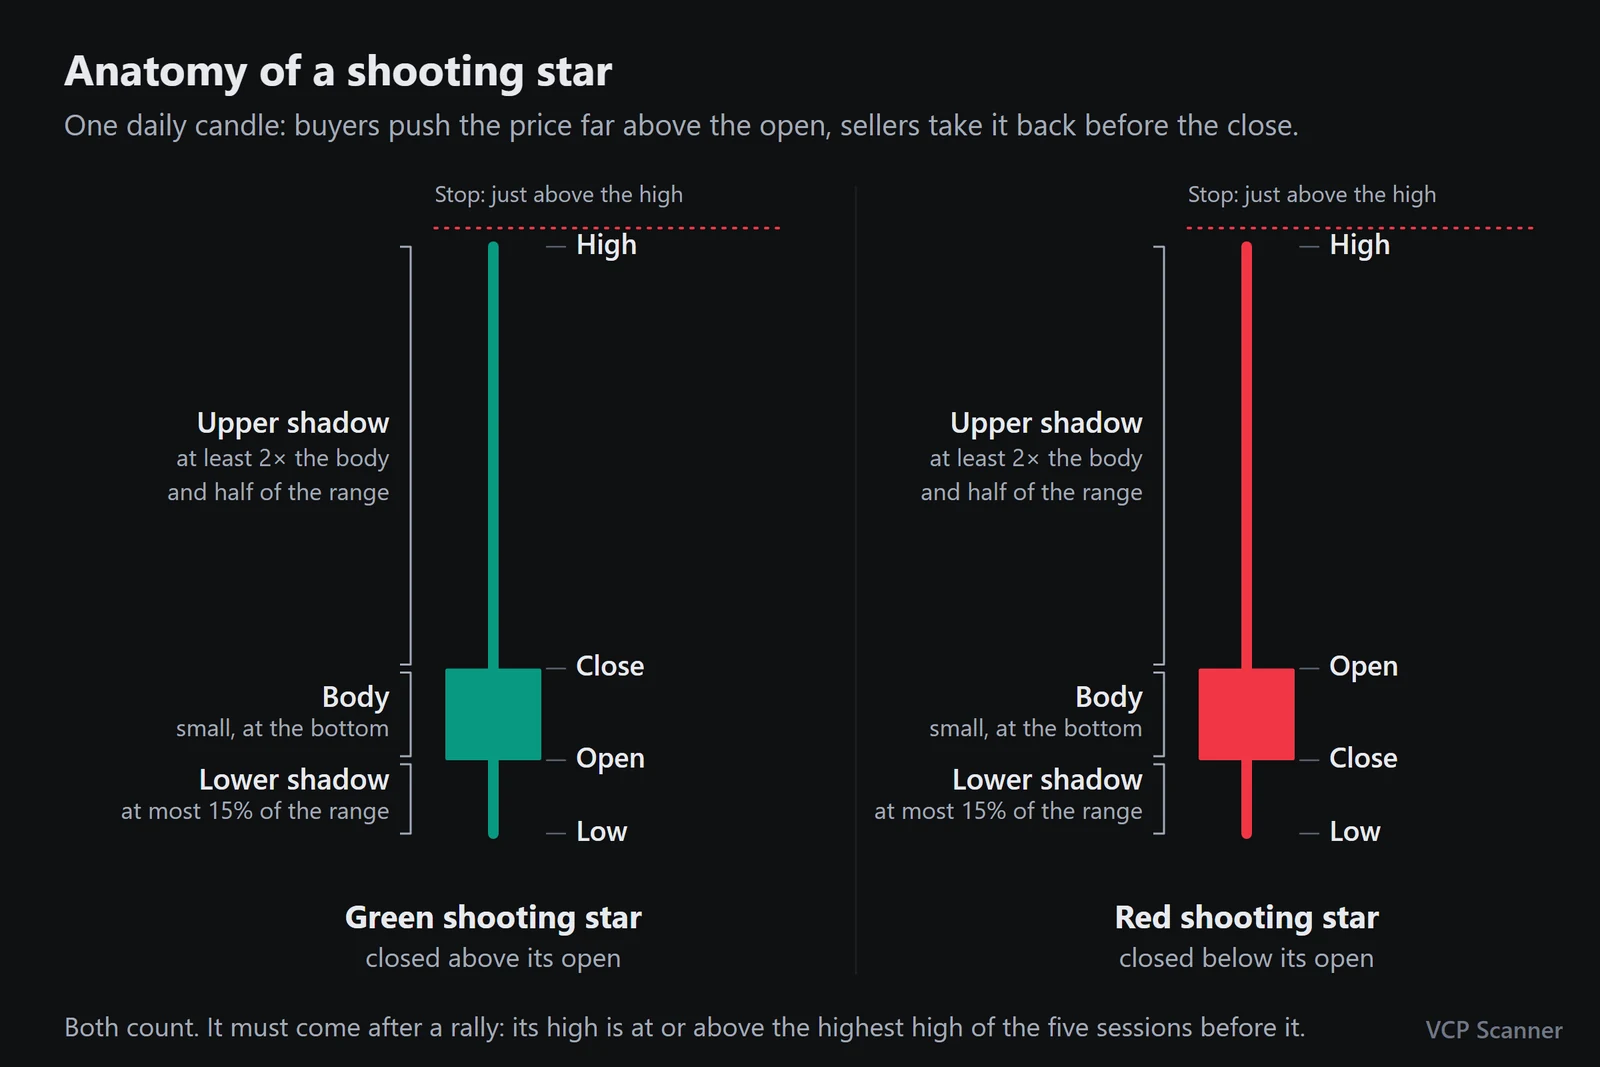
These are the rules the VCP Scanner terminal uses to name a shooting star on a daily chart.
| Part | Rule |
|---|---|
| Upper shadow | At least 2× the body, and at least half of the day's range |
| Lower shadow | At most 15% of the day's range |
| Body | Small, at the bottom of the range; red or green both count |
| Size | The day's range is at least half of the 14-day ATR |
| Position | Its high is at or above the highest high of the five sessions before it |
The body's colour does not matter. Nvidia's shooting star below was red (it closed under its open) and Marvell's was green, and both marked the top.
The position rule matters most. A shooting star comes after a rally. The same shape after a decline is an inverted hammer.
Same shape, different place#
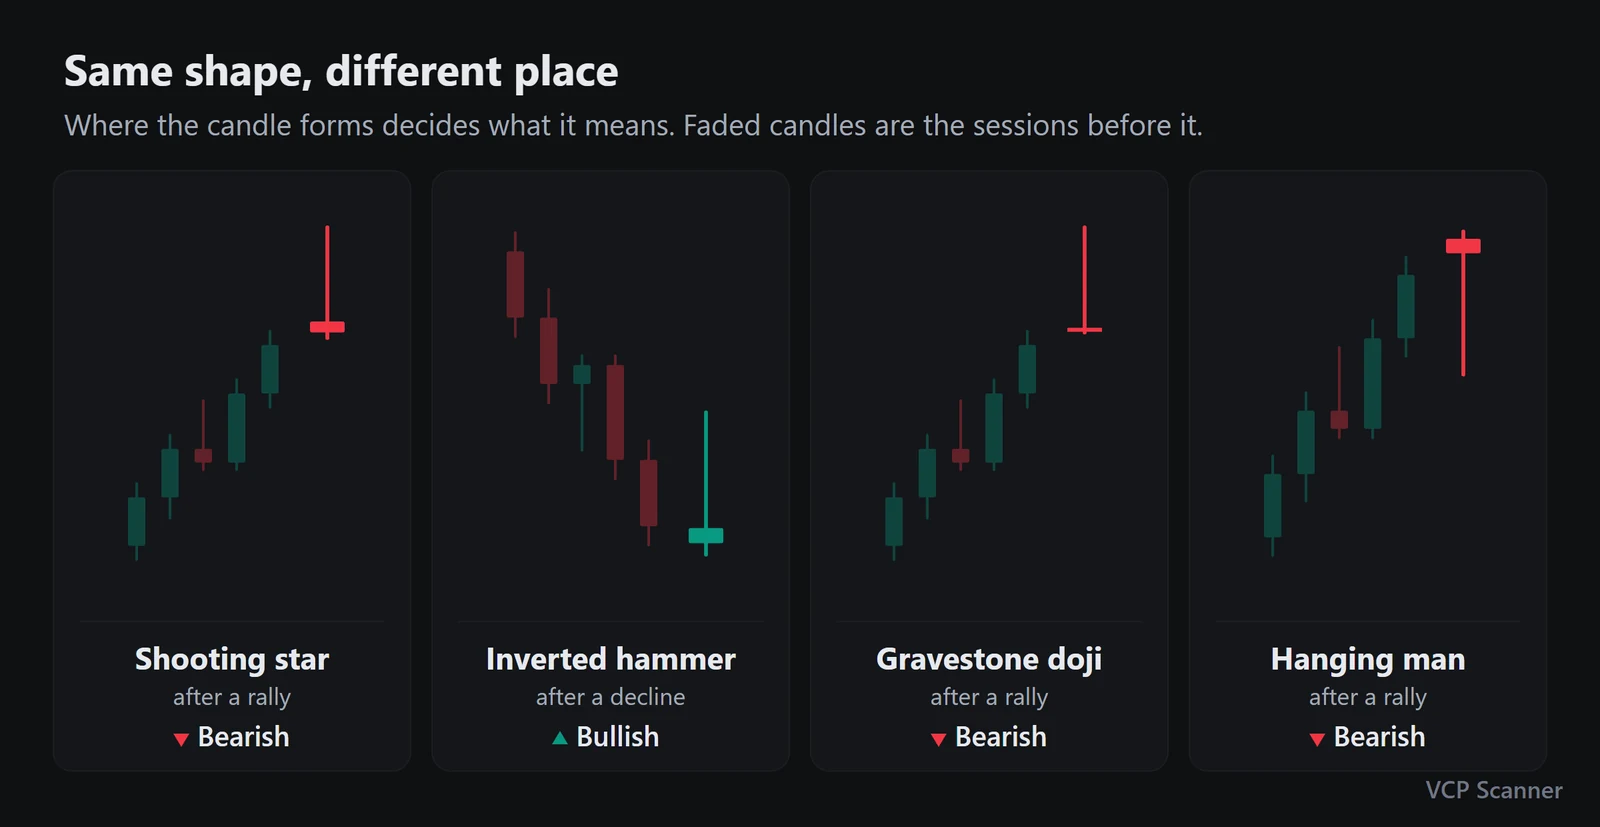
| Candle | Shape | Forms after | Reads as |
|---|---|---|---|
| Shooting star | Long upper shadow, body at the bottom | A 5-session high | Bearish |
| Inverted hammer | Long upper shadow, body at the bottom | A 5-session low | Bullish |
| Gravestone doji | Almost no body, long upper shadow | A 5-session high | Bearish |
| Hanging man | Long lower shadow, body at the top | A 5-session high | Bearish |
A gravestone doji is a shooting star with almost no body: its body is at most 10% of the range and its upper shadow at least 70%. When a candle fits both, the terminal names it a gravestone doji first. The hanging man has the hammer's shape, formed after a five-session high.
Example 1: Nvidia (NVDA) at its 2018 record high, Oct 2, 2018#
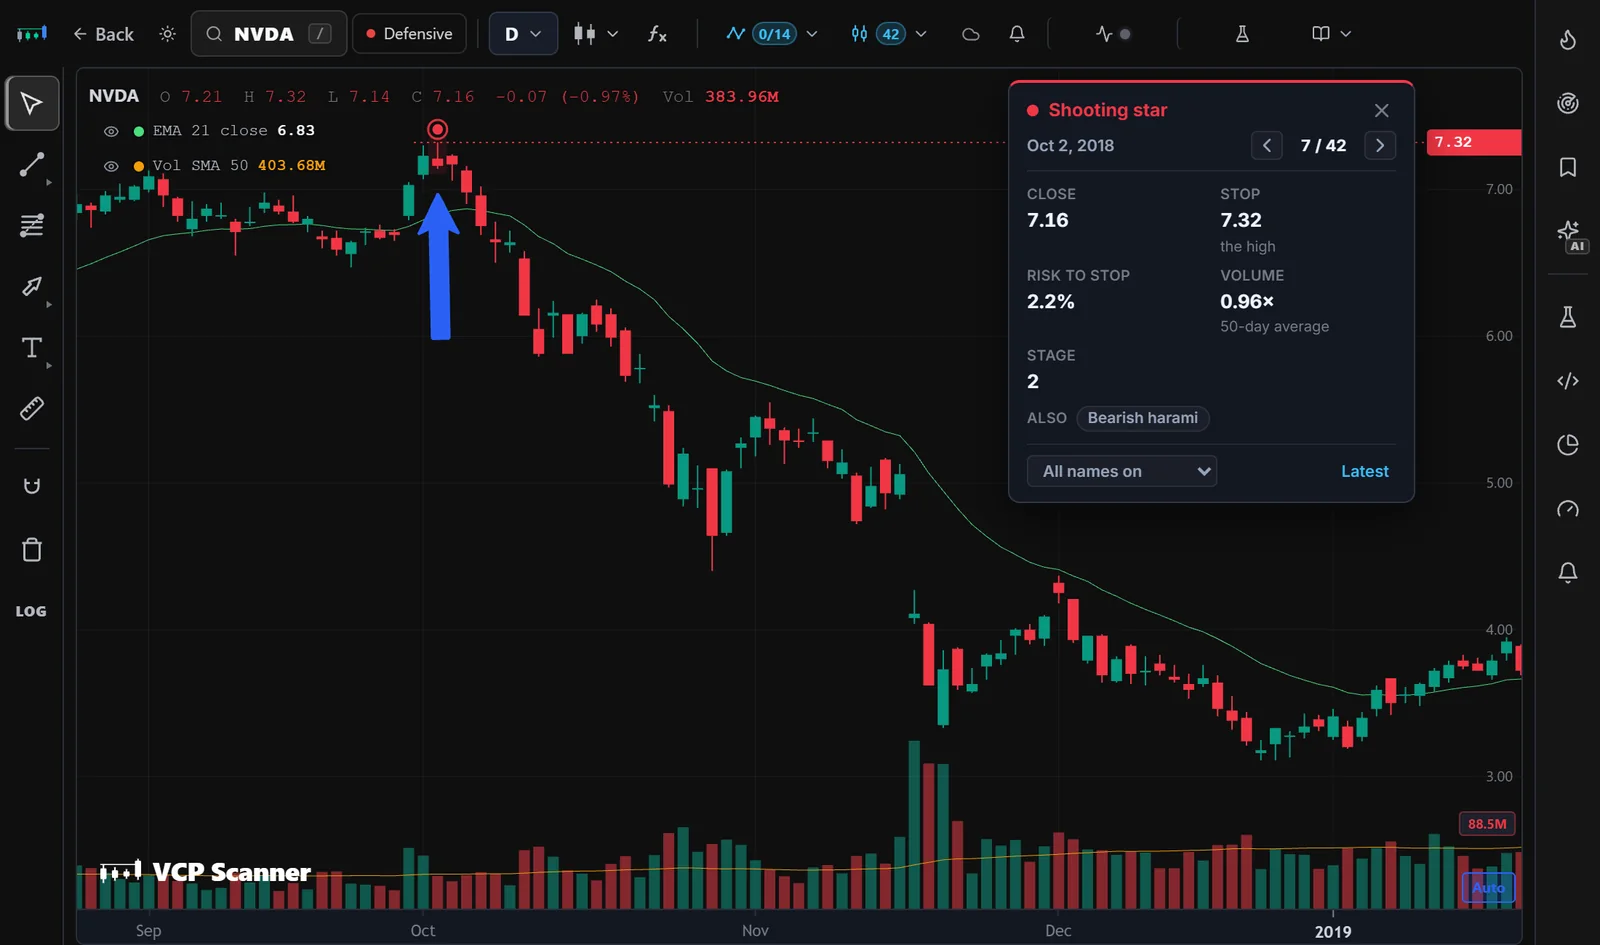
Open NVDA in the VCP Scanner terminal →
| Fact | NVDA, Oct 2, 2018 |
|---|---|
| Open / high / low / close | 7.21 / 7.32 / 7.14 / 7.16 |
| Upper shadow | 0.11: 2.2× the 0.05 body, 61% of the range |
| Lower shadow | 0.02, 11% of the range |
| High | A record, above every earlier price; no key level |
| Stop | 7.32, the shooting star's high |
| Risk to stop | 2.2% |
| Volume | 0.96× the 50-day average |
| Stage | 2 |
| Also | Bearish harami |
What followed:
- Next session (Oct 3): closed at 7.17, +0.1%, still above the shooting star's low of 7.14.
- Two sessions later (Oct 4): 6.98, the first close below that low.
- Ten sessions later (Oct 16): 6.15, −14.1%.
- Twenty sessions later (Oct 30): 5.08, −29.1%.
- Dec 24: 3.18, −55.6%. That is 24.9 times the 0.16 risked on each share.
- The high of 7.32 held for 344 sessions, more than a year, until Feb 14, 2020.
About a quarter of the fall came in one gap: on Nov 16, 2018, the session after its earnings report, Nvidia opened 19.4% lower.
With $500 at risk, the stop sized a short at 3,124 shares, about $22,368. At the Dec 24 close the short was up $12,434.
Example 2: Marvell (MRVL) at its June 2026 top#
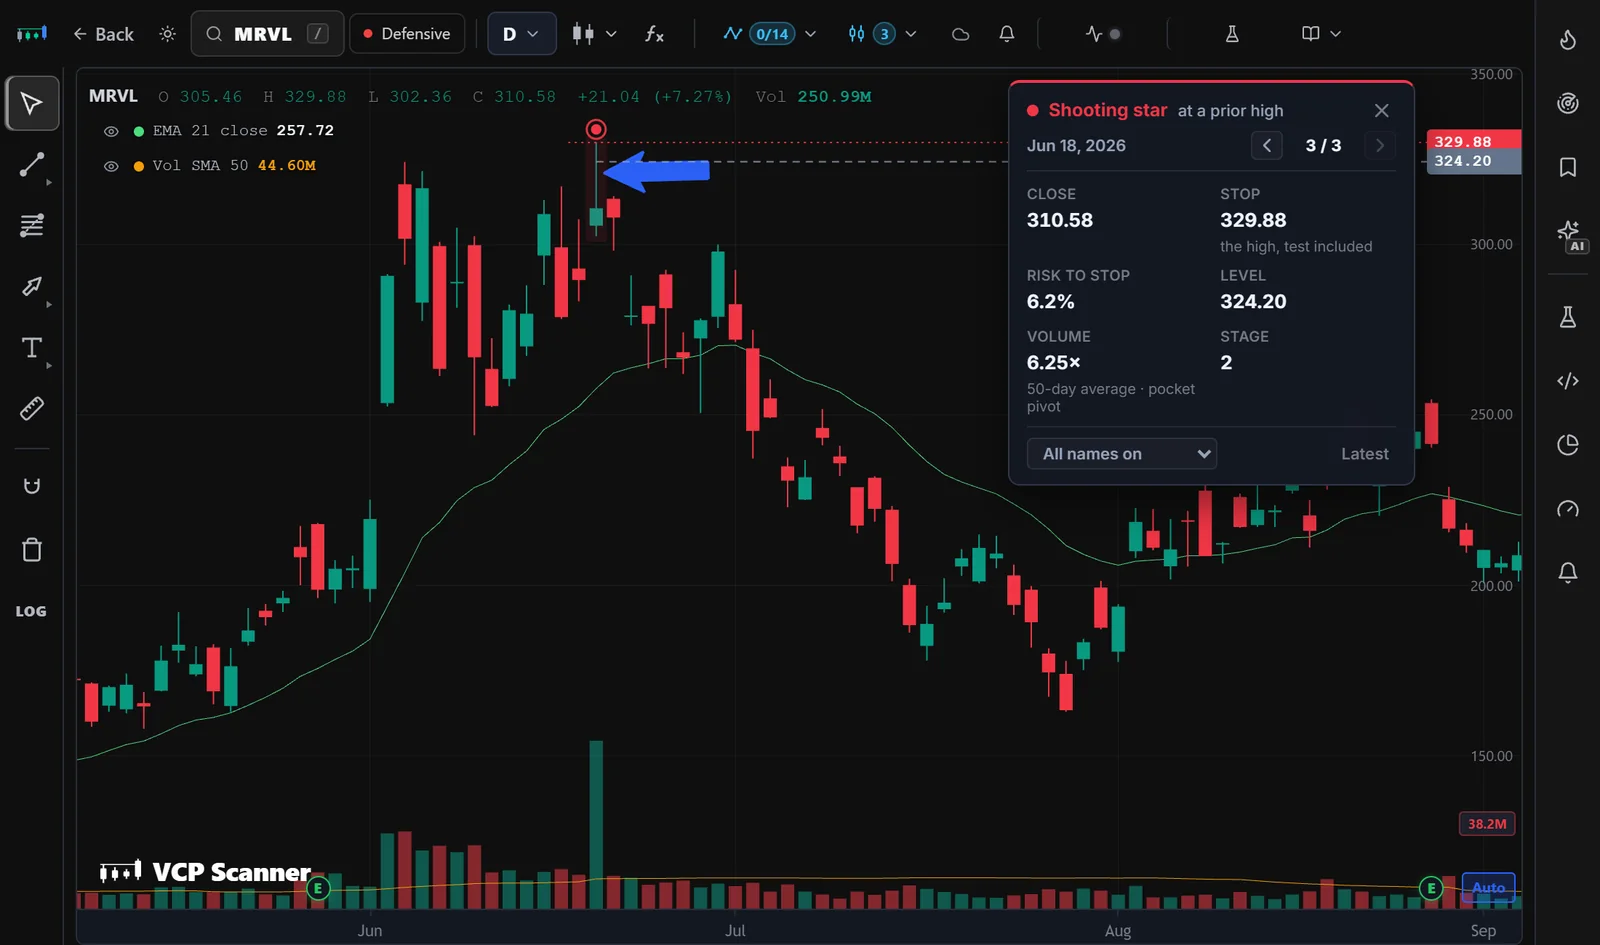
Open MRVL in the VCP Scanner terminal →
| Fact | MRVL, Jun 18, 2026 |
|---|---|
| Open / high / low / close | 305.46 / 329.88 / 302.36 / 310.58 |
| Upper shadow | 19.30: 3.8× the 5.12 body, 70% of the range |
| Lower shadow | 3.10, 11% of the range |
| Level | A prior high: the Jun 3, 2026 swing high at 324.20, poked and closed back below |
| Stop | 329.88, the shooting star's high |
| Risk to stop | 6.2% |
| Volume | 6.25× the 50-day average |
| Stage | 2 |
What followed:
- Next session (Jun 22): closed at 307.86, −0.9%.
- Two sessions later (Jun 23): 279.04, the first close below the shooting star's low of 302.36.
- Ten sessions later (Jul 6): 249.27, −19.7%.
- Twenty sessions later (Jul 20): 194.94, −37.2%.
- Jul 29: 163.40, −47.4%. That is 7.6 times the 19.30 risked on each share.
- The high of 329.88 was never taken out. The highest price since is 314.17. On Nov 3, 2026 Marvell closed at 171.97, 44.6% below the shooting star's close.
With $500 at risk, the stop sized a short at 25 shares, about $7,765. At the Jul 29 close the short was up $3,679.
Where a shooting star counts: key levels#
A shooting star on a level is a test of that level from below. In the terminal, the Only at a key level switch is on by default and keeps the shooting stars that close back below one of these:
| Level | What it is |
|---|---|
| A prior high | A swing high at least 10 sessions old that price trades above for the first time, then closes back below |
| A failed breakout's pivot | The pivot of a breakout that failed, met again from below |
| The 50-day from below | The 50-day moving average, falling, with the stock in Stage 3 or 4 |
| The 21-day EMA from below | The 21-day exponential average, under a falling 50-day, in Stage 3 or 4 |
Marvell's 2026 shooting star was a prior-high shooting star: it poked above the Jun 3 high and closed back below it. Nvidia's 2018 star set a record, so there was no earlier high to poke, and it sat on none of these levels. To see shooting stars like that one, turn Only at a key level off.
Both stocks were in Stage 2, Stan Weinstein's advancing stage: the stock trades above a rising 30-week average. A shooting star in Stage 2 marks a top inside an uptrend, a place to take profits or tighten a stop as much as a place to short.
How to trade a shooting star#
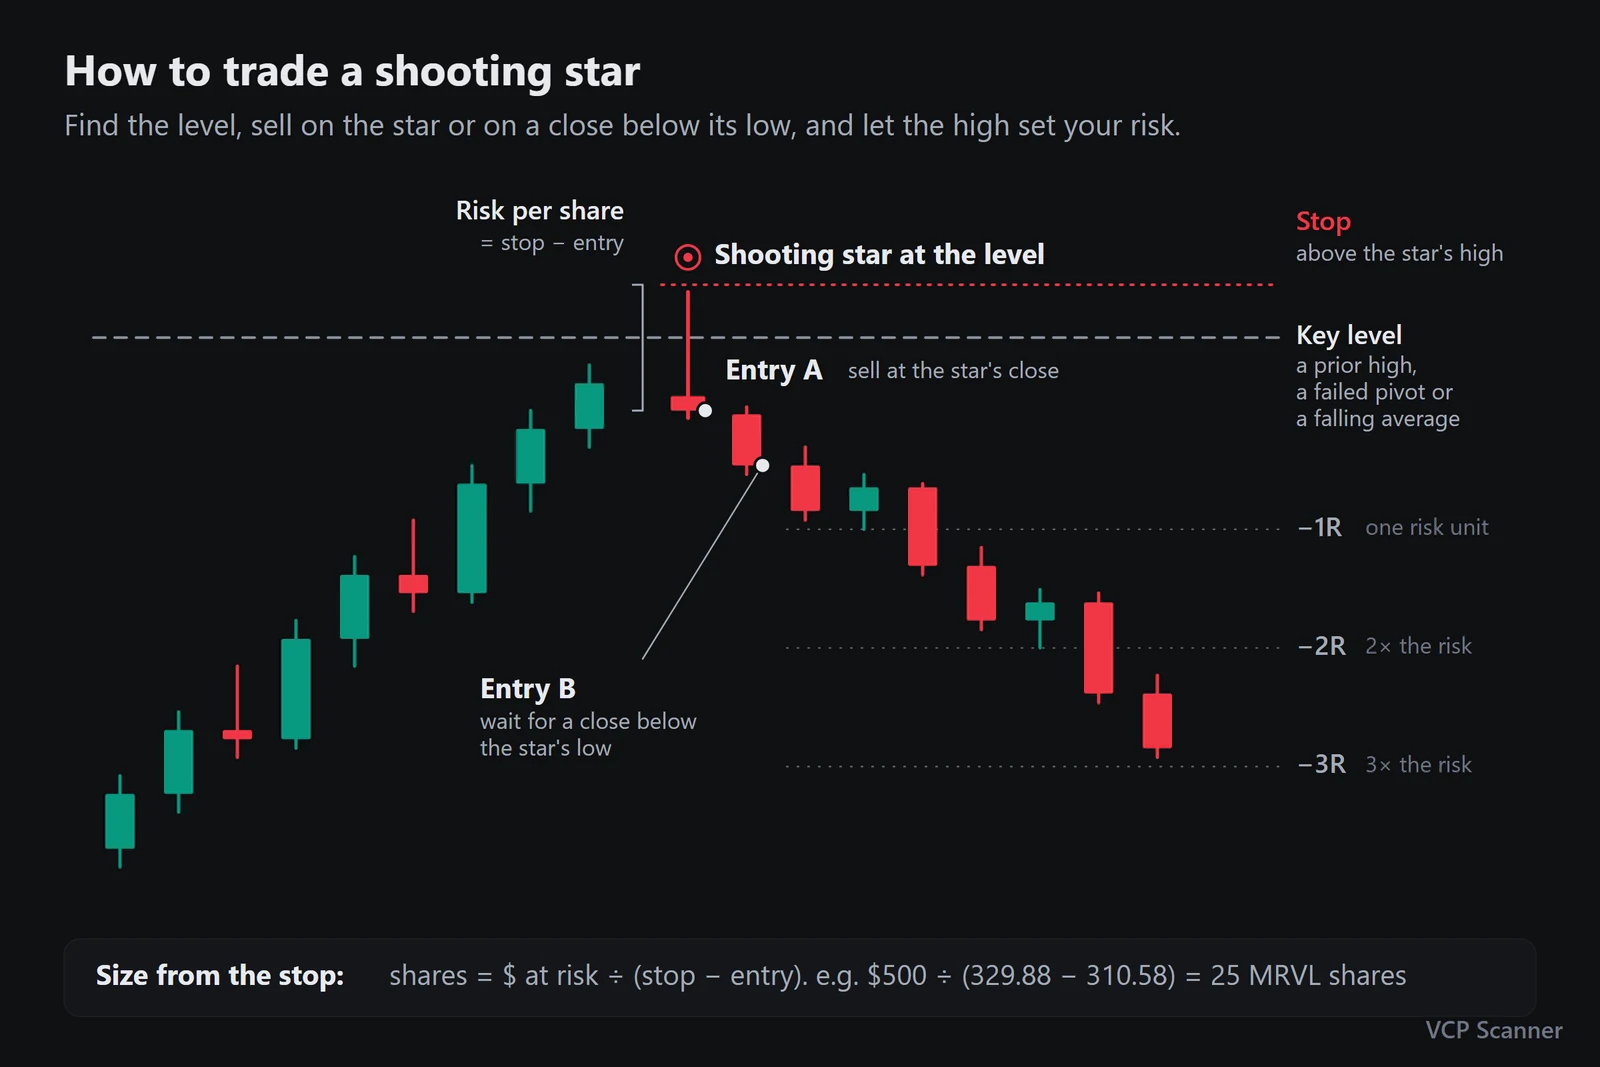
- Find the high. A shooting star comes after a rally. Look for it at a prior high, a failed breakout's pivot, a falling average or a fresh record, like Marvell's in 2026 and Nvidia's in 2018.
- Check the shape. The upper shadow is at least twice the body, with little or no lower shadow. Nvidia's was 2.2× and Marvell's 3.8×.
- Choose your entry. Holders sell or tighten their stop at the star's close, and some short sellers enter there. Others wait for a close below its low. Nvidia and Marvell both gave that close two sessions later.
- Put the stop above the high. Above the shooting star's high, or above the highest high of the test if price went higher earlier in it. The terminal calls this "the high, test included".
- Size from the stop. Shares = money at risk ÷ (stop − entry). With $500 at risk on Marvell: 500 ÷ (329.88 − 310.58) = 25 shares.
Find shooting stars on any chart in VCP Scanner#
- Open a stock in the terminal, for example NVDA or MRVL.
- Open Candles in the chart toolbar and tick Shooting star, or use the Bearish quick pick for every bearish candle on the chart.
- Only at a key level is on by default. Turn it off to see every shooting star on the chart.
- The chart jumps to the latest shooting star. A dot marks each one above its high, and the selected one shows its stop on the price scale.
- The inspector lists the close, stop, risk to stop, level, volume and stage. Walk through the others with the ← and → keys.
- Mark the ones you care about with the drawing tools. The arrows in the charts above are the Arrow Marker (Alt+A): click where the arrow starts, then click the candle.
Candles are free, on daily, weekly and monthly charts.
Bottom line#
- A shooting star is a long upper shadow after a rally: buyers pushed the price up, and sellers took it back the same day.
- Nvidia's shooting star marked its 2018 record high and Marvell's its June 2026 top. They risked 2.2% and 6.2%, and the stocks fell 55.6% and 47.4% within 60 sessions.
- The shooting star's high is the stop. It defines your risk before you take the trade.
Data: VCPScanner daily market data through Nov 3, 2026, split-adjusted. The examples are for education, not recommendations.
Quick answers
Is a shooting star candlestick bearish?
Yes. It is a bearish reversal candle that shows sellers rejecting higher prices after a rally. Nvidia's shooting star on Oct 2, 2018 and Marvell's on Jun 18, 2026 both marked the high of their rallies.
Does the colour of a shooting star matter?
No. A red and a green shooting star follow the same shape rules. Nvidia's 2018 shooting star was red and Marvell's 2026 one was green, and both marked the top.
What is the difference between a shooting star and an inverted hammer?
They have the same shape. A shooting star forms after a five-session high, an inverted hammer after a five-session low.
Where does the stop go on a shooting star?
Above the shooting star's high. If price went higher earlier in the same test of a level, the stop goes above that higher high instead.
Does a shooting star need confirmation?
Many traders wait for a close below the shooting star's low. Nvidia and Marvell both gave that close two sessions later, at 6.98 on Oct 4, 2018 and at 279.04 on Jun 23, 2026.
All 44 candles on one cheat sheet.
Enter your email and download it right away. You also get our weekly market brief, every Friday.